SNDL Inc. (SNDL), headquartered in Calgary, Canada, distributes and sells cannabis products. The company has moved forward with significant expansionary efforts this year, notably with the acquisition of The Valens Company Inc. and four cannabis retail stores under the Dutch Love Cannabis banner.
However, its profitability scenario looks concerning. For instance, its trailing-12-month EBITDA margin of negative 6.34% compares to the industry average of 4.45%, while its trailing-12-month CAPEX/Sales of 1.24% is 73.6% lower than the 4.68% industry average.
Given this backdrop, let’s look at the trends of SNDL’s key financial metrics to understand why it could be wise to avoid the stock now.
Analyzing SNDL's Financial Performance: Significant Fluctuations and Trends
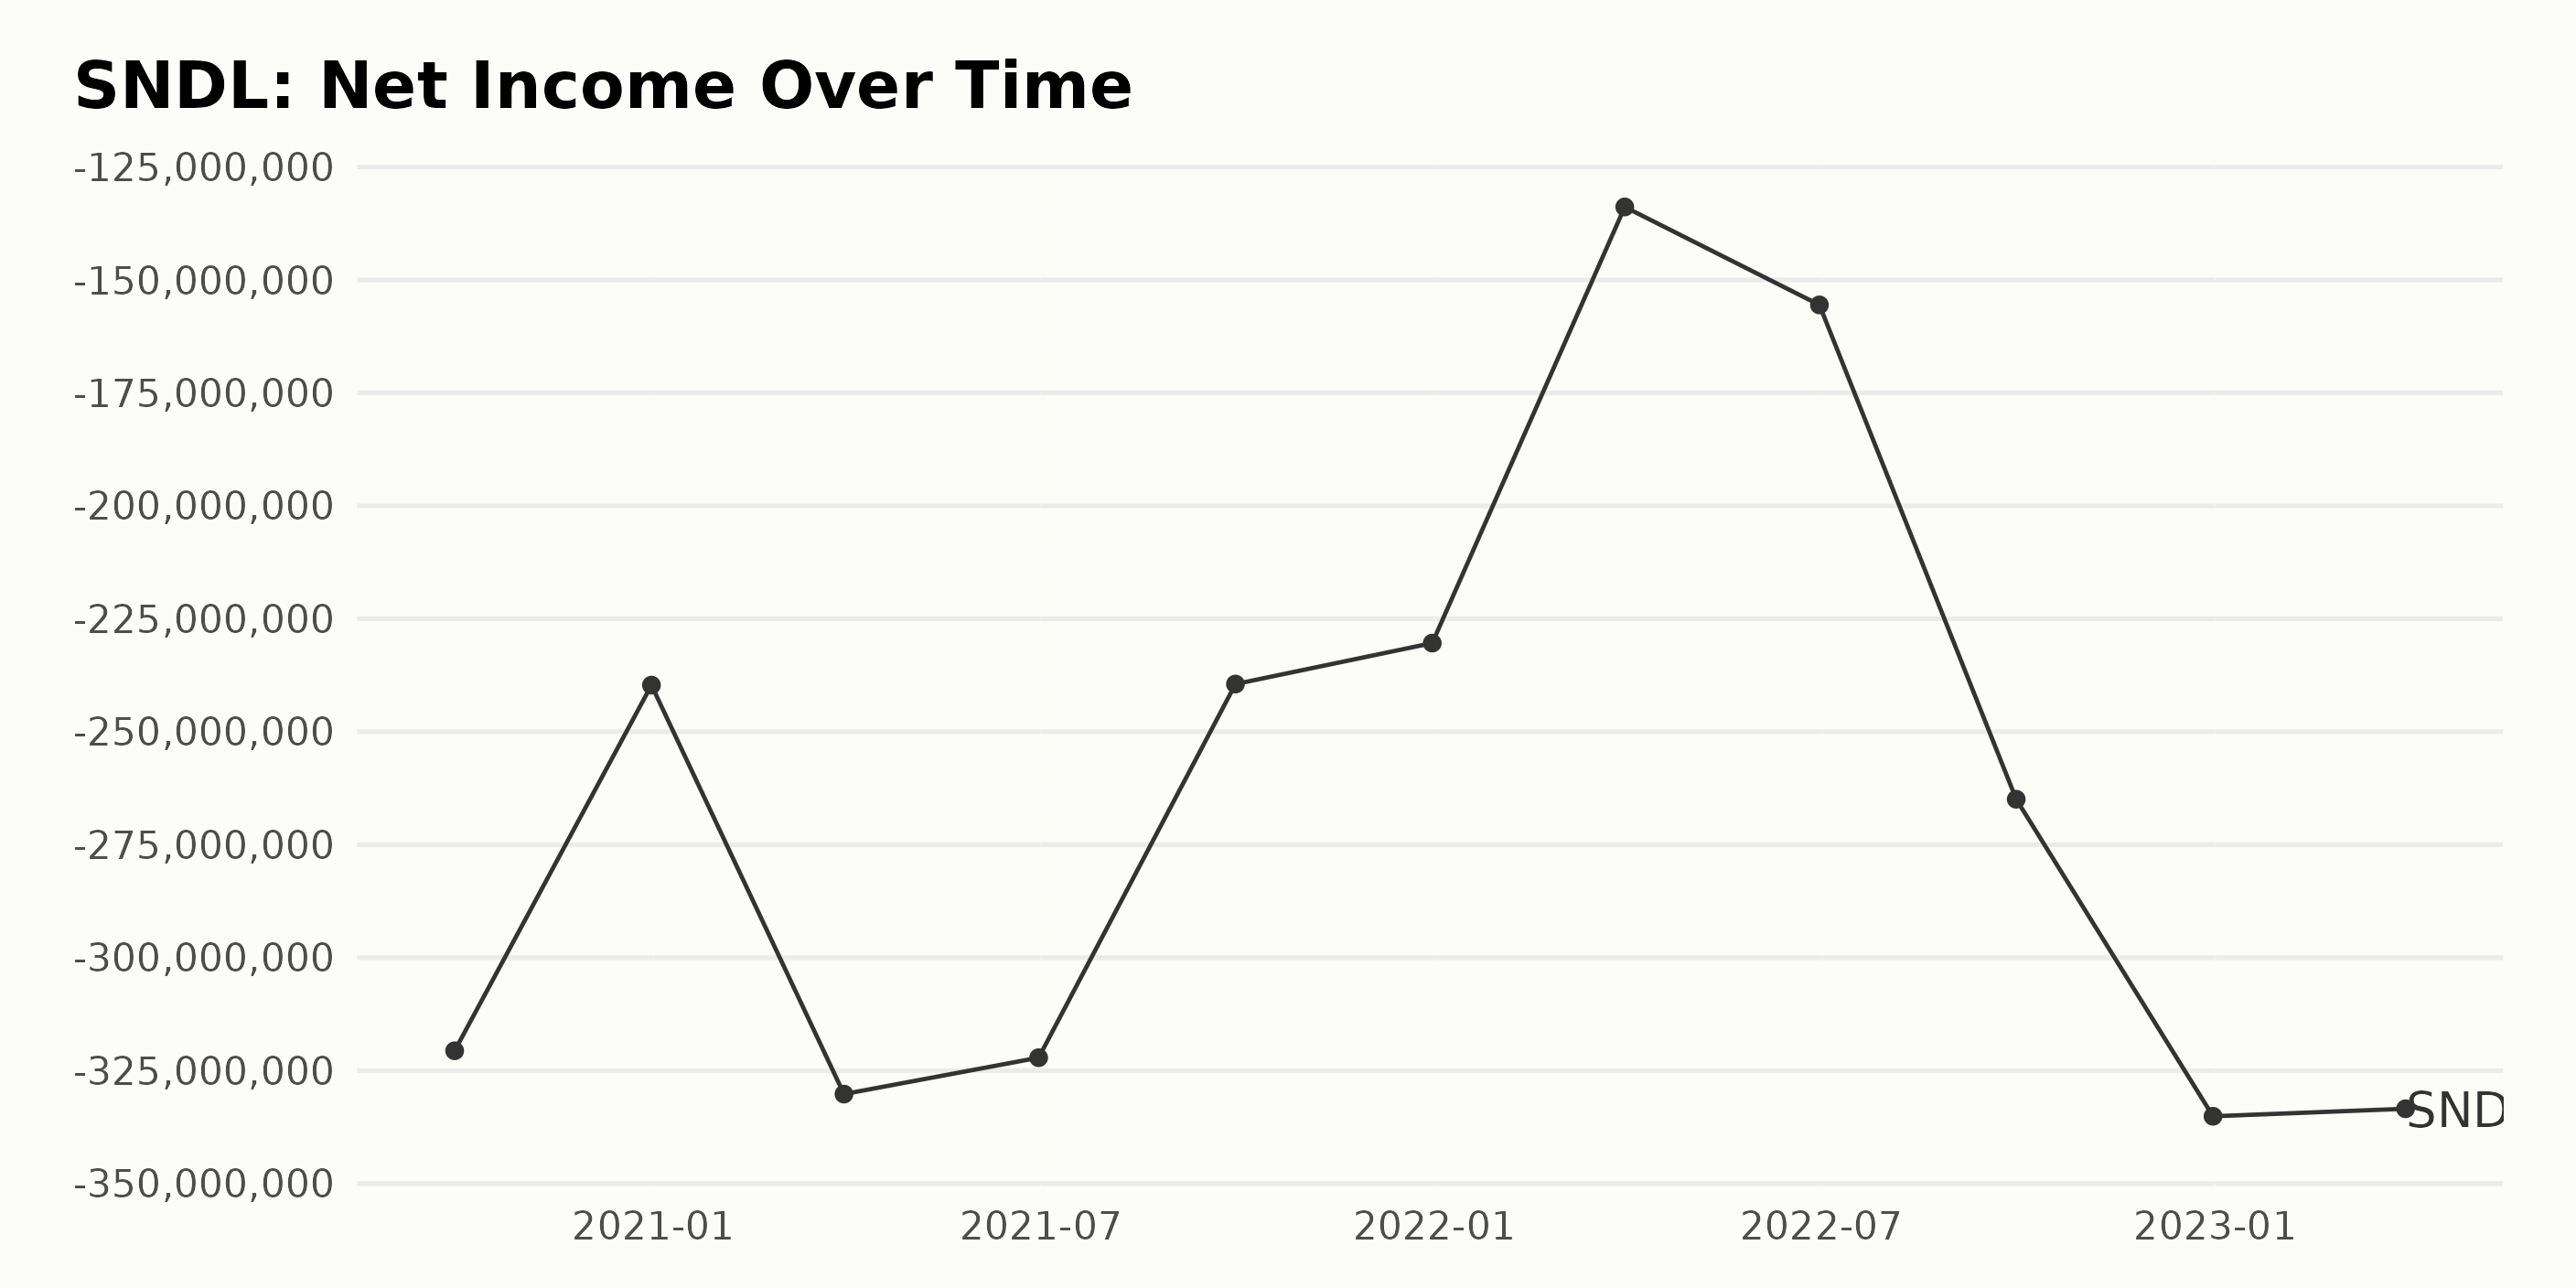
The trailing-12-month net income of SNDL has seen significant fluctuations over the last several years. Although there's some variation on a quarter-by-quarter basis, the general trend indicated by the data seems to be negative in nature.
- At the start of our series, on September 30, 2020, SNDL reported a net loss of $320.61 million.
- There was a brief improvement toward the end of 2020, with a lessened net loss of $239.68 million as of December 31, 2020.
- This relief was short-lived as the net loss rose again to $330.20 million by March 31, 2021, and maintained a high level of around $322.15 million in June 2021.
- By the end of 2021, the losses decreased slightly to $230.38 million and then significantly to $133.84 million in March 2022 before rebounding to $155.53 million in June 2022.
- Despite this downward trend, net losses increased dramatically to $264.95 million in September 2022, reaching the peak for the series at $335.11 million by December 31, 2022.
- As of the most recent data point, March 31, 2023, the net loss stands at $333.45 million.
From September 2020 to March 2023, SNDL’s net income indicates that the company's financial performance has generally worsened over this period. However, it is worth noting that more recent data show some signs of decreasing losses, suggesting potential future improvements in the company's position. Further analysis would be necessary to validate this tentative observation.
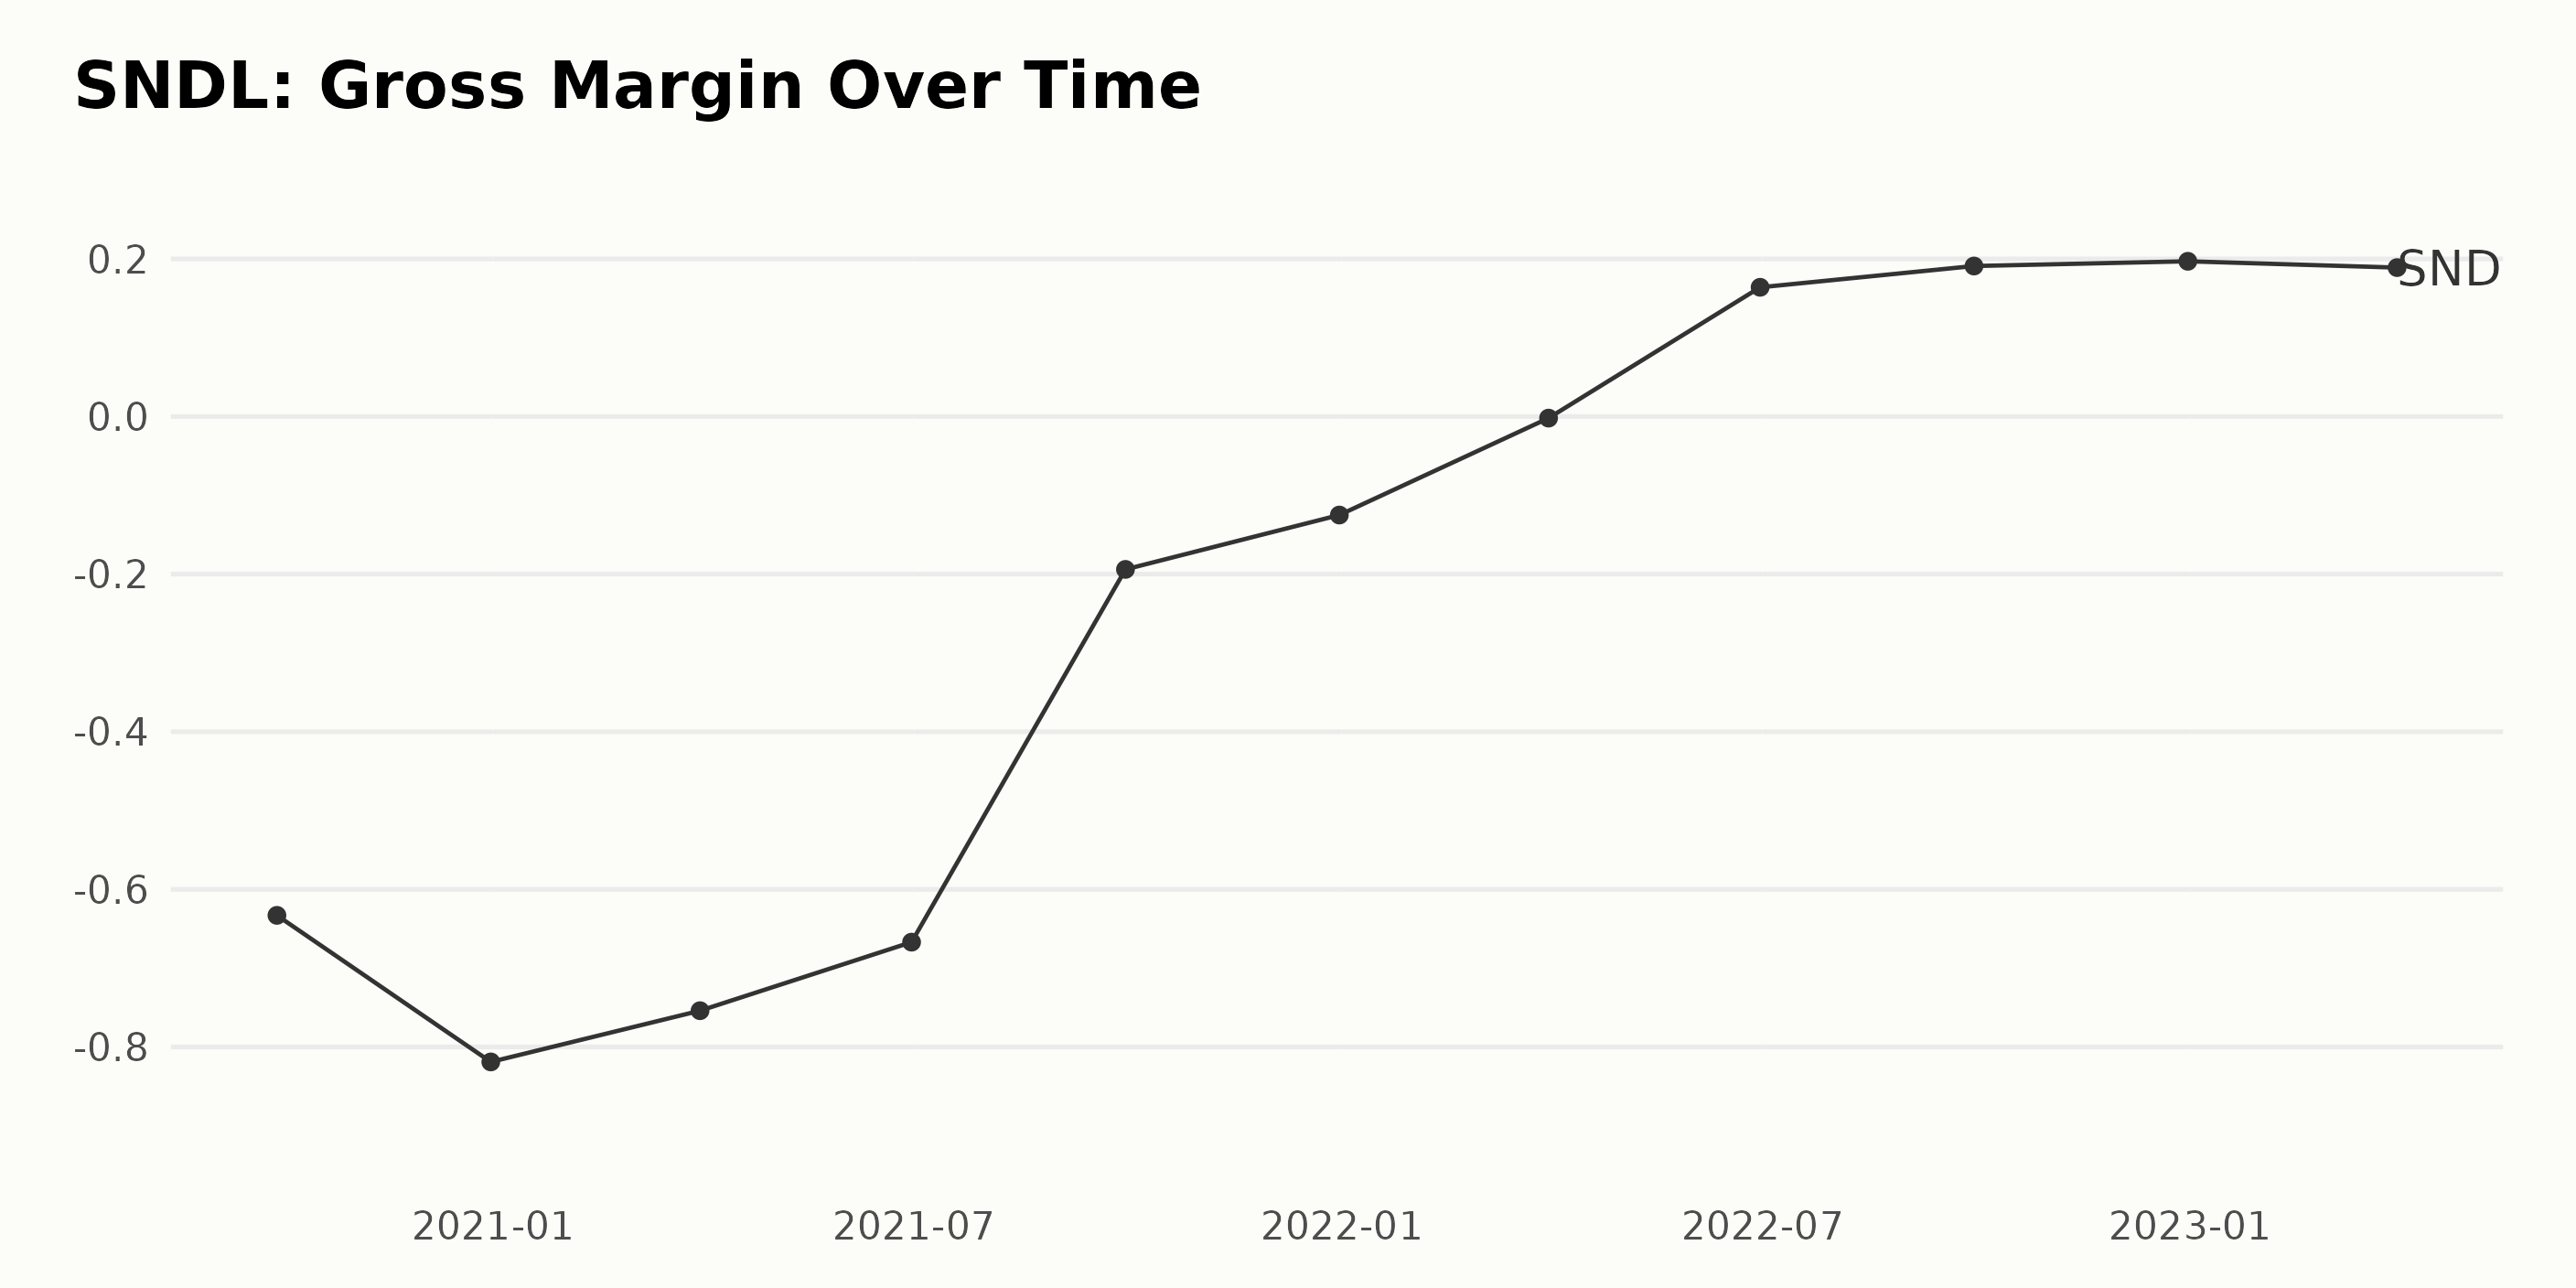
Here's a summary of the fluctuations and trends in the gross margin reported by SNDL:
- From September 30, 2020, to December 31, 2020, the gross margin of SNDL decreased from -63.3% to -81.9%, showing a further downward trend.
- The negative gross margin continued until June 30, 2022, displaying an oscillating yet overall upward trend during this period. It started from -75.4% on March 31, 2021, sinking to -66.7% on June 30, 2021, then slowly rose to -19.4% on September 30, 2021, and -12.5% on December 31, 2021.
- A significant improvement was seen between March 31, 2022, and June 30, 2022. The gross margin increased from -0.2% to 16.4%, marking the first positive value in the series.
- The upward trend was extended from June 30, 2022, to December 31, 2022. The gross margin increased even further to 19.7% by the end of 2022.
- As of the most recent figure on March 31, 2023, there has been a slight decrease to 18.9%, but still maintaining a positive gross margin.
Growth-rate Calculation: The gross margin presented substantial growth, moving from -63.3% on September 30, 2020, to 18.9% on March 31, 2023.
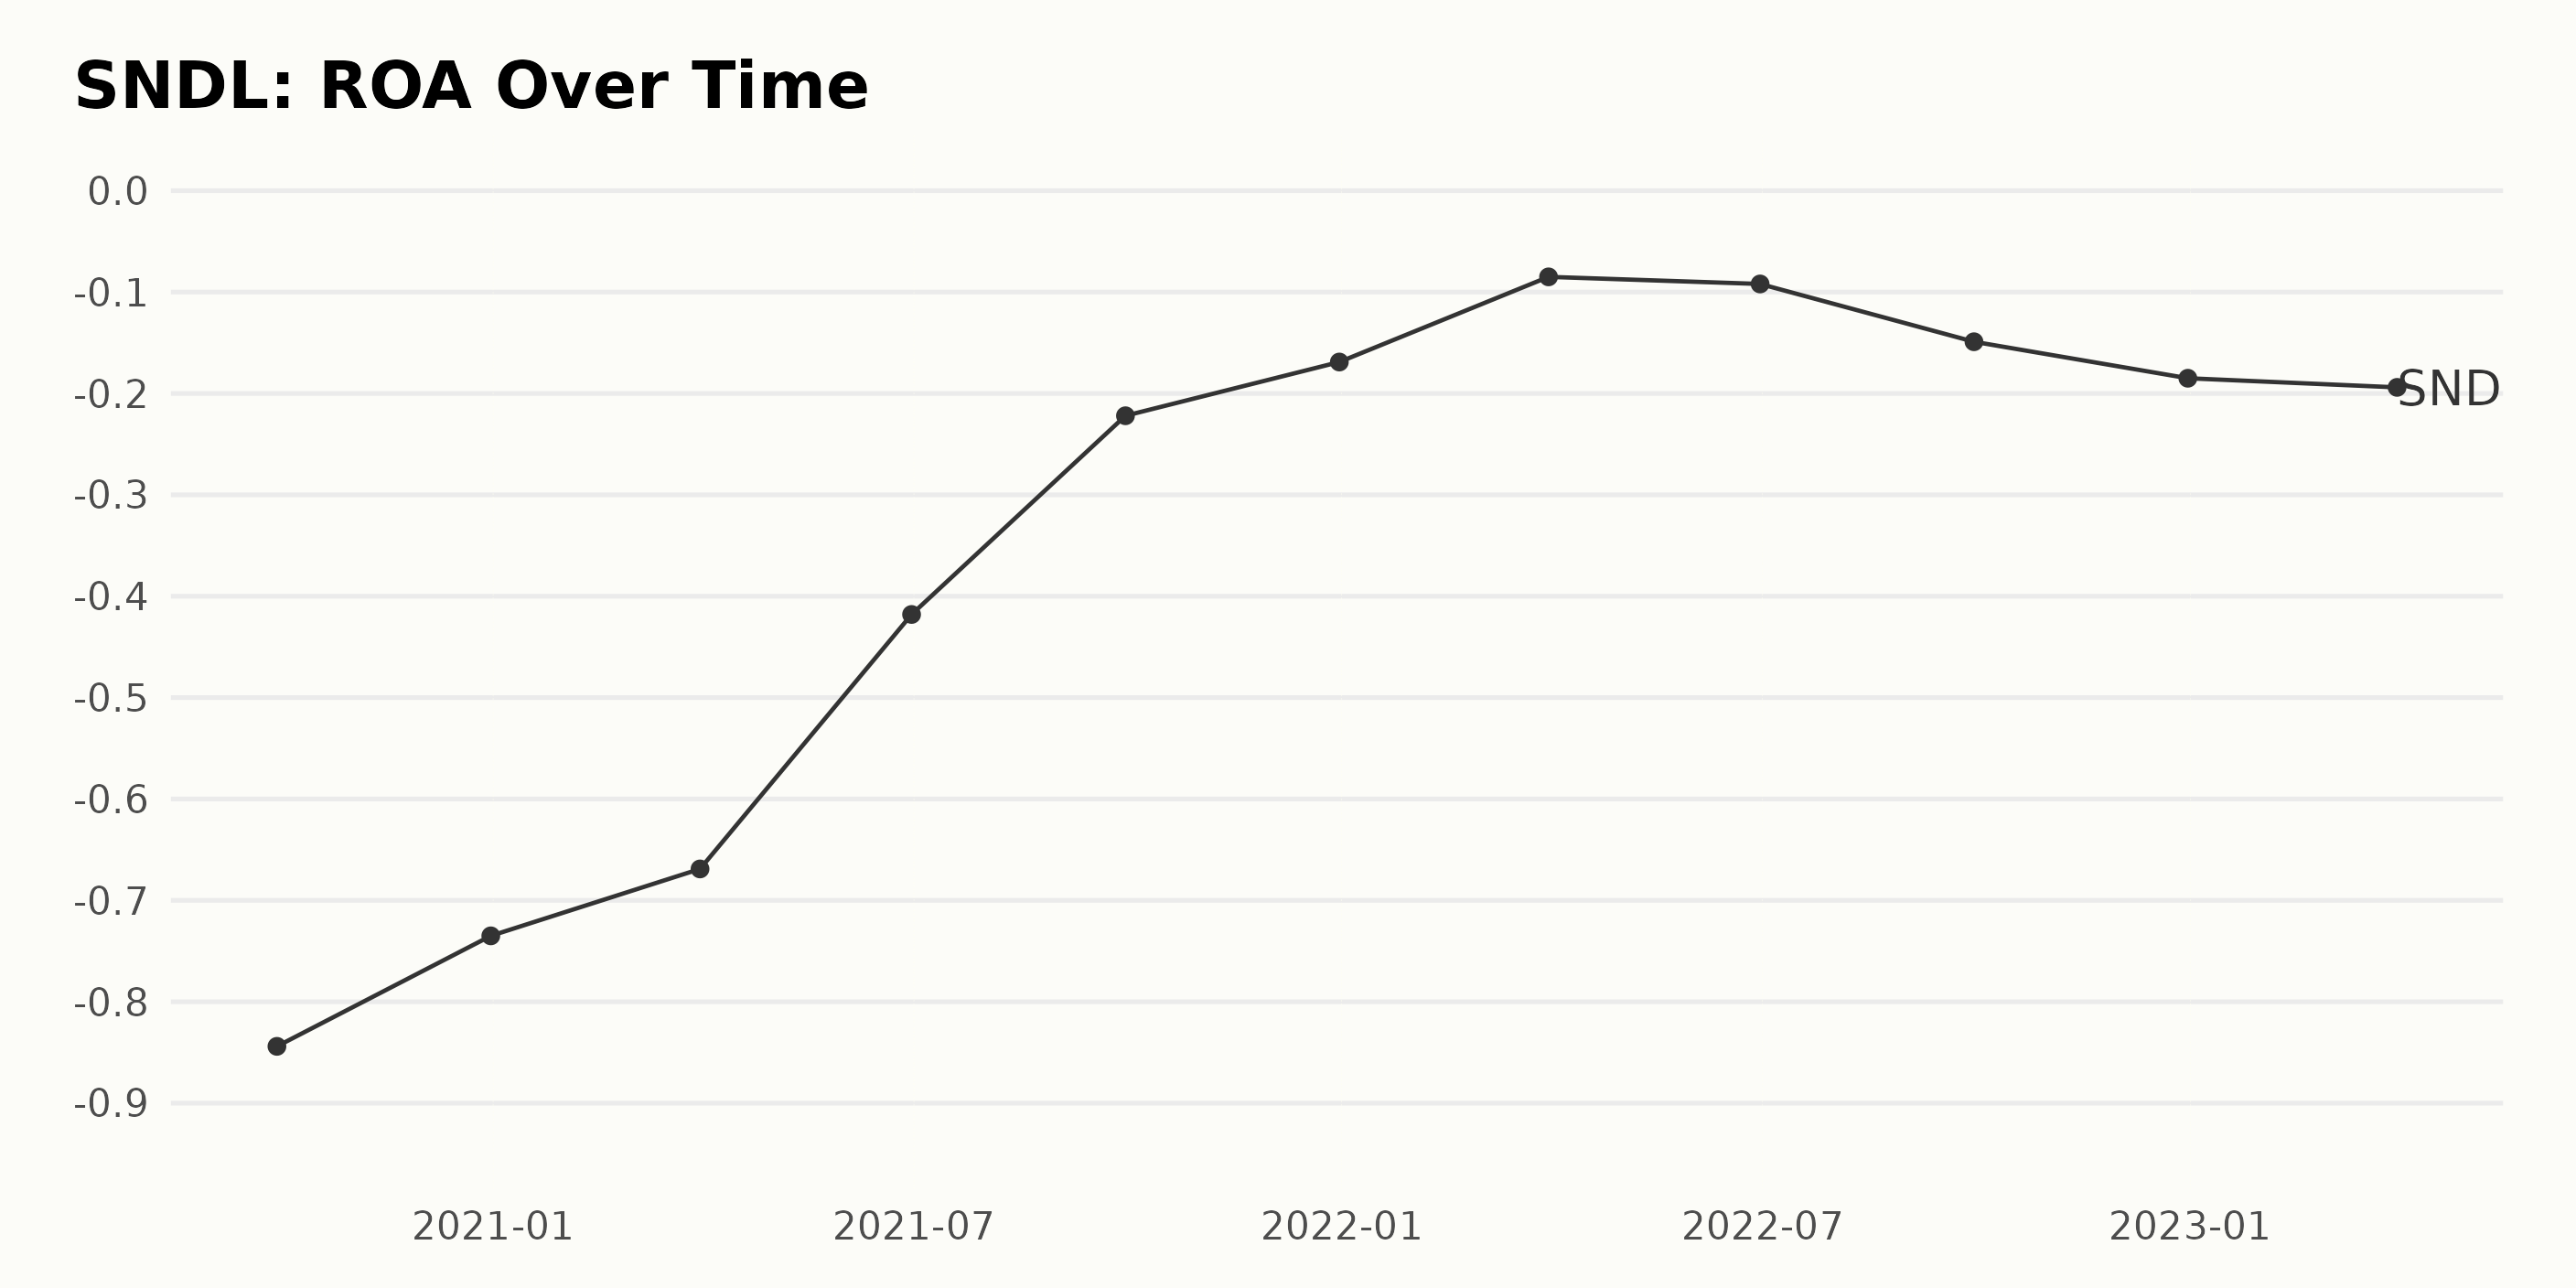
The Return On Assets (ROA) of SNDL experienced a downward trend overall from September 30, 2020, to March 31, 2023.
- On September 30, 2020, the company recorded an ROA of -84.4%. However, there was a consistent improvement over four quarters as the ROA reduced to -41.8% by June 30, 2021.
- It further improved to -22.2% by September 30, 2021, representing positive growth.
- In an unforeseen turn, the figures for the last quarter of 2021 till the first quarter of 2022 showed a trend of a minimally fluctuating reduction, from -16.9% and -8.5%, respectively.
- The trend subsequently took a negative turn, with a slight increase to -9.2% in the second quarter of 2022. This was followed by deteriorations in the last two quarters of that year, with figures of -14.9% and -18.5%.
- The series ended with SNDL reporting an ROA of -19.4% for the first quarter of 2023.
From the above, it's noticeable that the recent data took a downturn, showing regression, particularly in the last quarter compared to the first. The total growth rate from the first value (September 2020: -84.4%) to the last value (March 2023: -19.4%) shows a decrease in losses by approximately 65%, indicating an overall improvement in the long run despite the more recent dips.
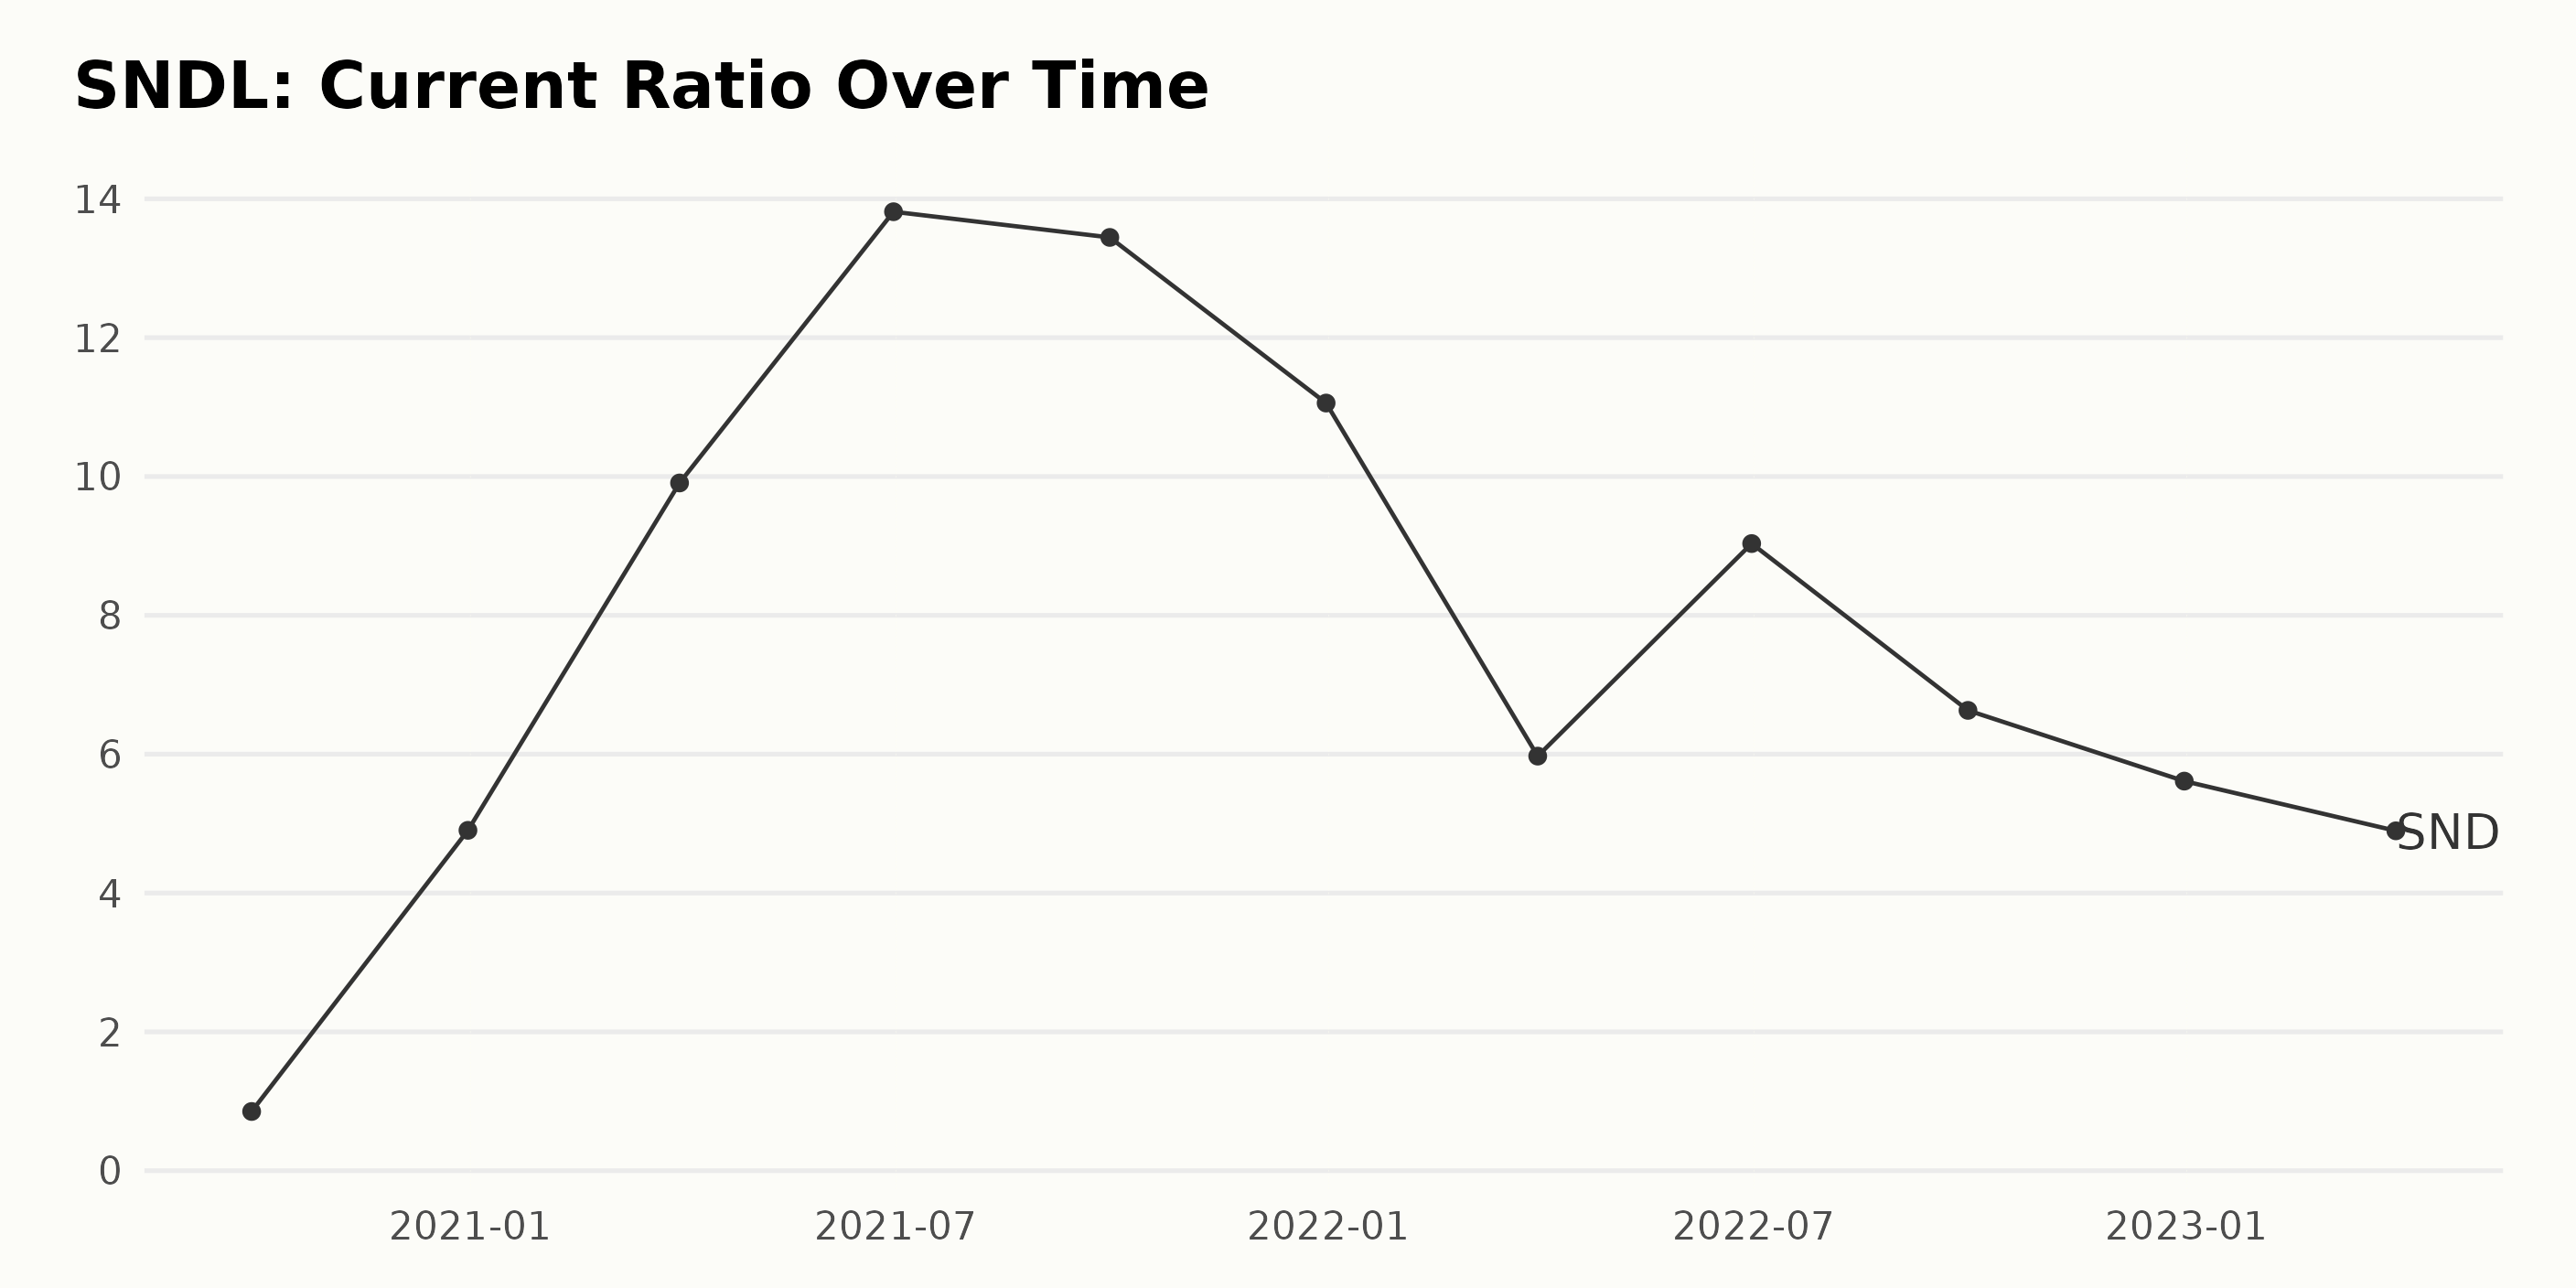
The current ratio of SNDL has exhibited substantial fluctuations from September 2020 to March 2023. From September 30, 2020, when it was 0.85, it sharply increased to reach a peak of 13.81 by June 2021. After reaching a peak in June 2021, it began a steady decline, closing at 4.90 by March 2023. Detailed Examination:
- On September 30, 2020, SNDL’s current ratio was relatively low at 0.85.
- This dramatically increased over the next few months to 4.90 on December 31, 2020, which indicates an increase in its capacity to cover its short-term obligations.
- The upward trend appeared to continue in the first half of 2021, where the current ratio spiked up, peaking at an impressive high of 13.81 by June 30, 2021.
- However, the third quarter of 2021 saw a slight decline to 13.44 as of September 30, 2021.
- A noticeable drop was observed in the fourth quarter of 2021 to 11.06 on December 31, 2021.
- As 2022 started, there was a considerable fall to 5.97 in March 2022, indicating that SNDL faced challenges maintaining the same liquidity levels.
- In contrast to previous downward fluctuation, June 2022 brought an improvement, with the current ratio climbing up to 9.03.
- Yet again, a considerable downward fluctuation occurred, with the current ratio retracting back to 6.63 for the third quarter of 2022.
- This downward movement continued, ending the year 2022 at 5.61 in December.
- The first quarter of 2023 hints towards a continuation of the downward trend as the current ratio fell further to 4.90 as of March 31, 2023.
Overall, the data reflects a growth rate of around 476.59%, comparing the last value (4.90 in March 2023) to the first value (0.85 in September 2020), though the value experienced quite a turbulence and ended in a downward trend. This pattern suggests an element of volatility in SNDL's short-term financial solvency.
Analysis of SNDL Stock: A Six-Month Overview (February-August 2023)
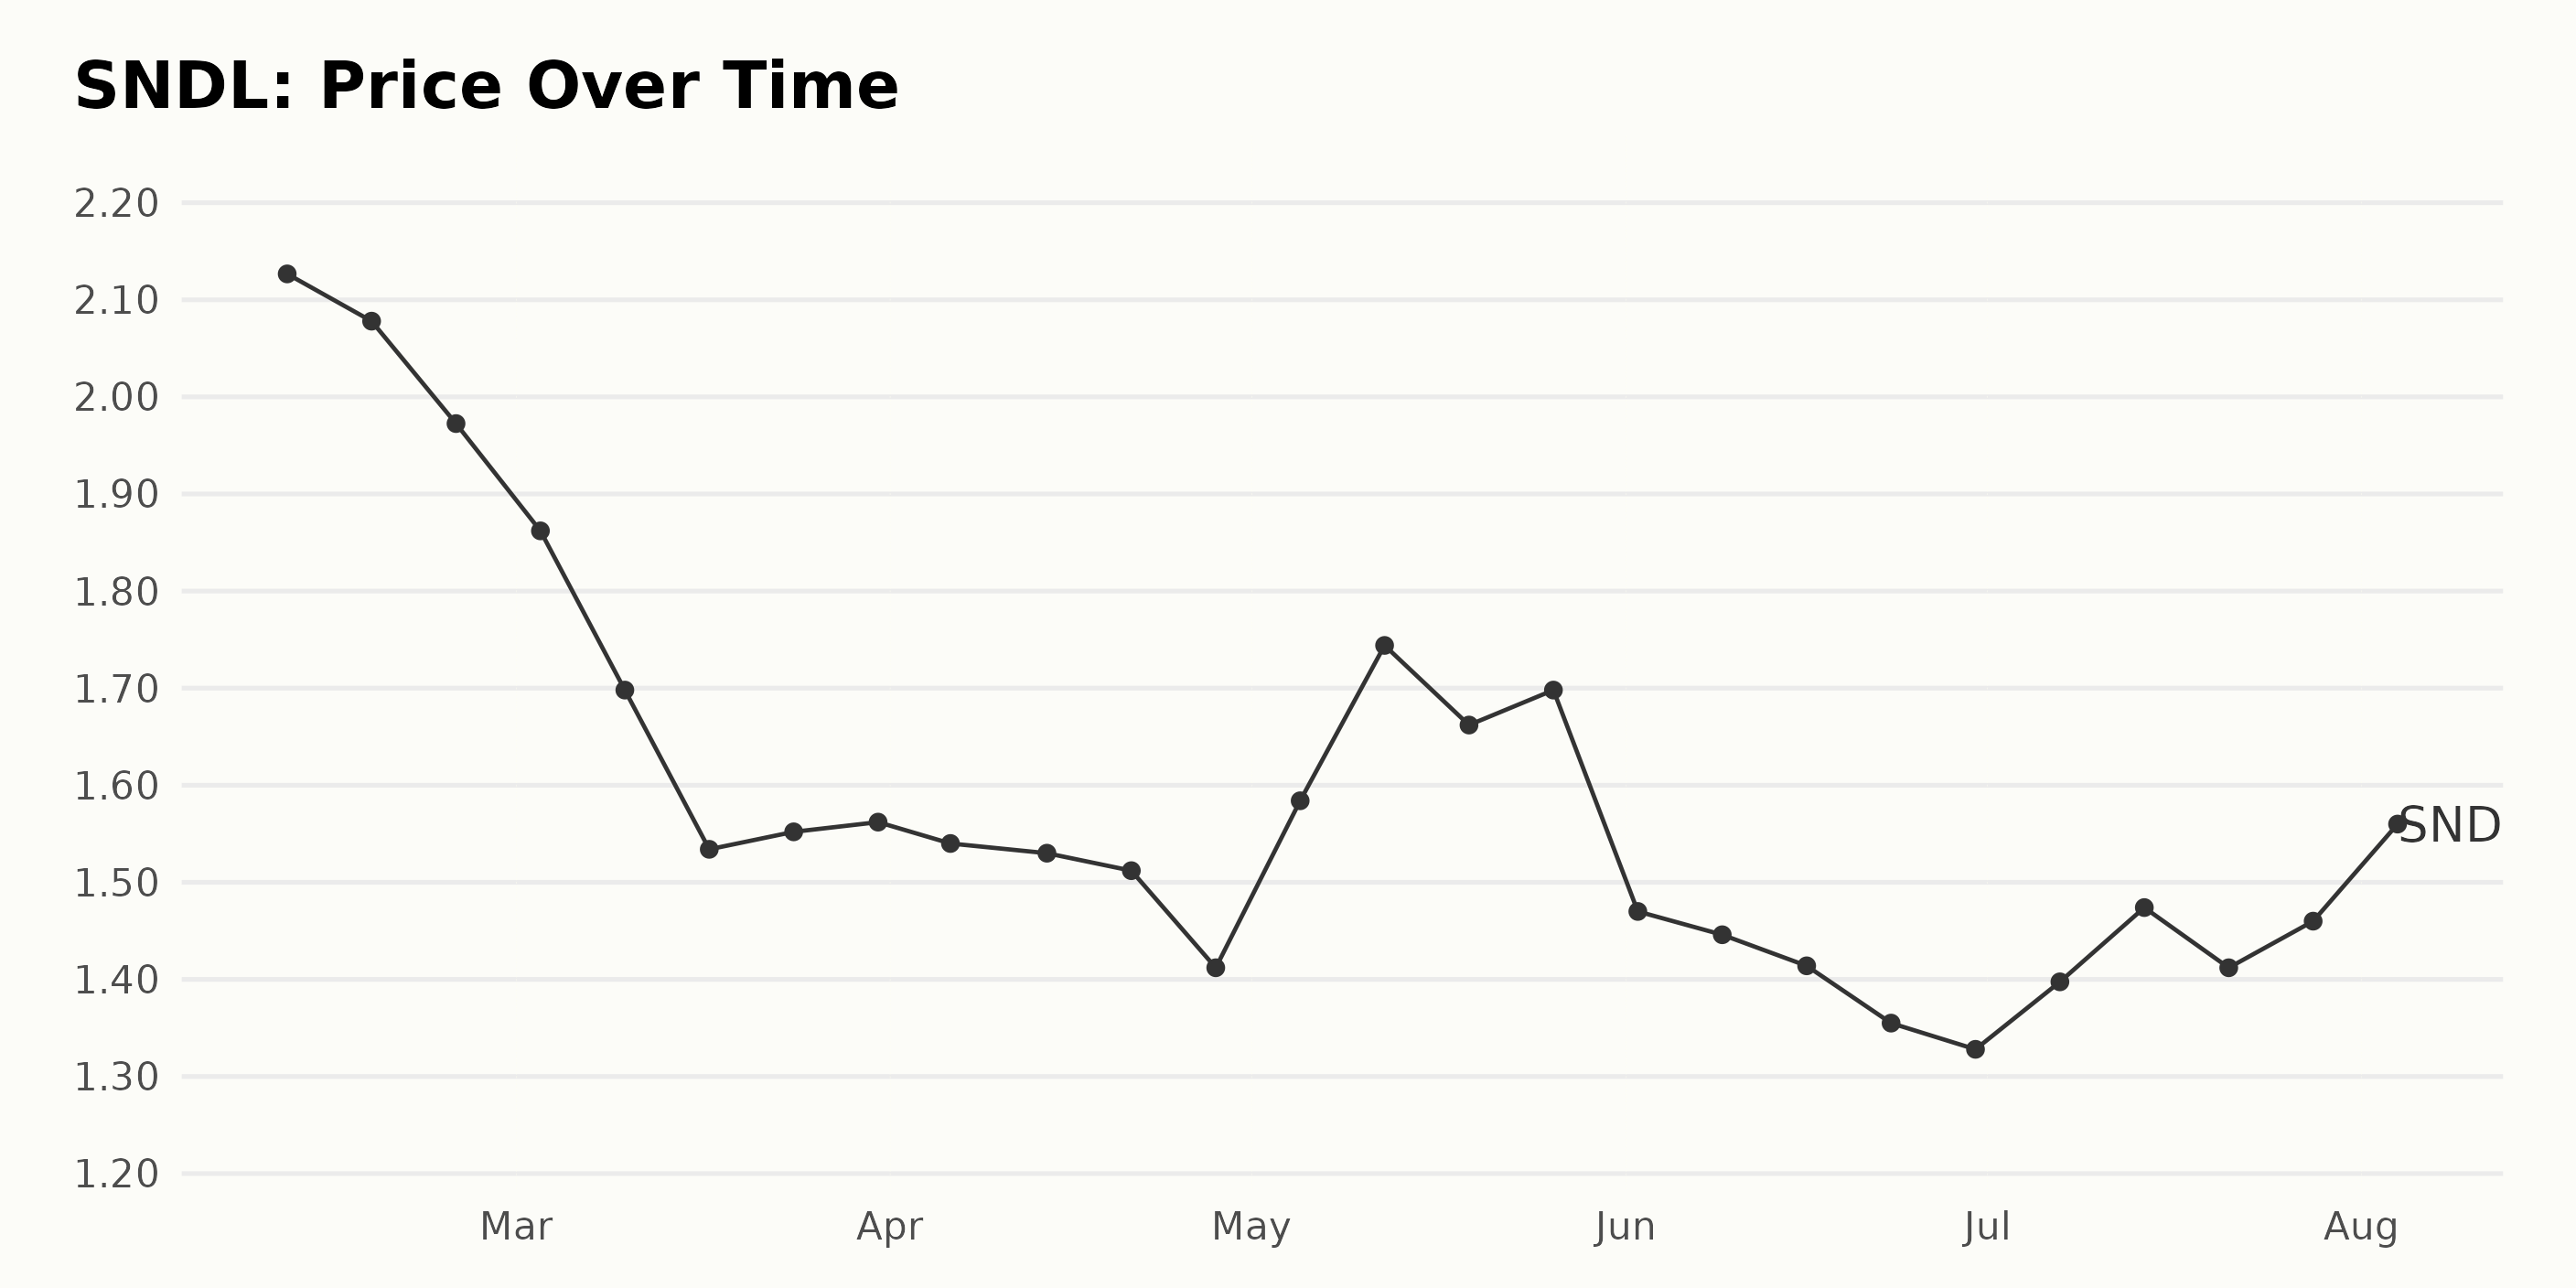
The data set presented records of the share price of SNDL spanning from February through August 2023. Here's a comprehensive analysis of this trend:
- On February 10, 2023, SNDL's price was $2.13. Throughout February, there was a slow decrease in the share price, ending at $1.97 by February 24.
- This decreasing trend continued into March; the share price on March 3 decreased to $1.86. By mid-March, the price had declined further to $1.53 but showed slight increases in the second half of the month––climbing to $1.56 by March 31.
- In April, the trend remained generally stable, with a minor fluctuation in price. The month began with a share price of $1.54 and saw a decrease to approximately $1.41 by its conclusion.
- In May, the share price demonstrated an initial surge, peaking at $1.74 on May 12. However, by the end of the month, it had reduced again to close at $1.70. - June displayed another downward trend, with the month starting at a share price of $1.47 and decreasing throughout, closing at $1.33 by the end of the month.
- In July, the price trend seemed to reverse, hitting a peak at $1.47 on July 14 before eventually settling at $1.46 towards the end of the month.
- Finally, as of August 4, 2023, the recorded share price had climbed to $1.49.
In summary, the growth rate of SNDL during this period seems to be negative, with several periods of smaller fluctuations. The stock consistently experienced declines from the start of the period in February to June 2023, followed by a slight upturn in the subsequent months. Here is a chart of SNDL's price over the past 180 days.
Analyzing SNDL's Performance: Tracing Trends in Growth, Value, and Sentiment
Based on the data provided, the current POWR Ratings grade of SNDL in the Medical - Pharmaceuticals category as of August 7, 2023, is F (Strong Sell). The rank in this category is #155 out of a total of 165 stocks. Here's a summary of the evolution of the POWR grade and its category ranking over the past few months:
- From February to May 2023, the POWR grade of SNDL was consistently at D (Sell). The rank in the Medical - Pharmaceuticals category fluctuated between #130 and #149 during this period.
- In June 2023, the POWR grade dropped to F (Strong Sell), with the stock's category ranking reaching #165.
- The following two months, July and August 2023, saw SNDL maintaining its F (Strong Sell) POWR grade. It slightly improved its position in the category to a rank of #155.
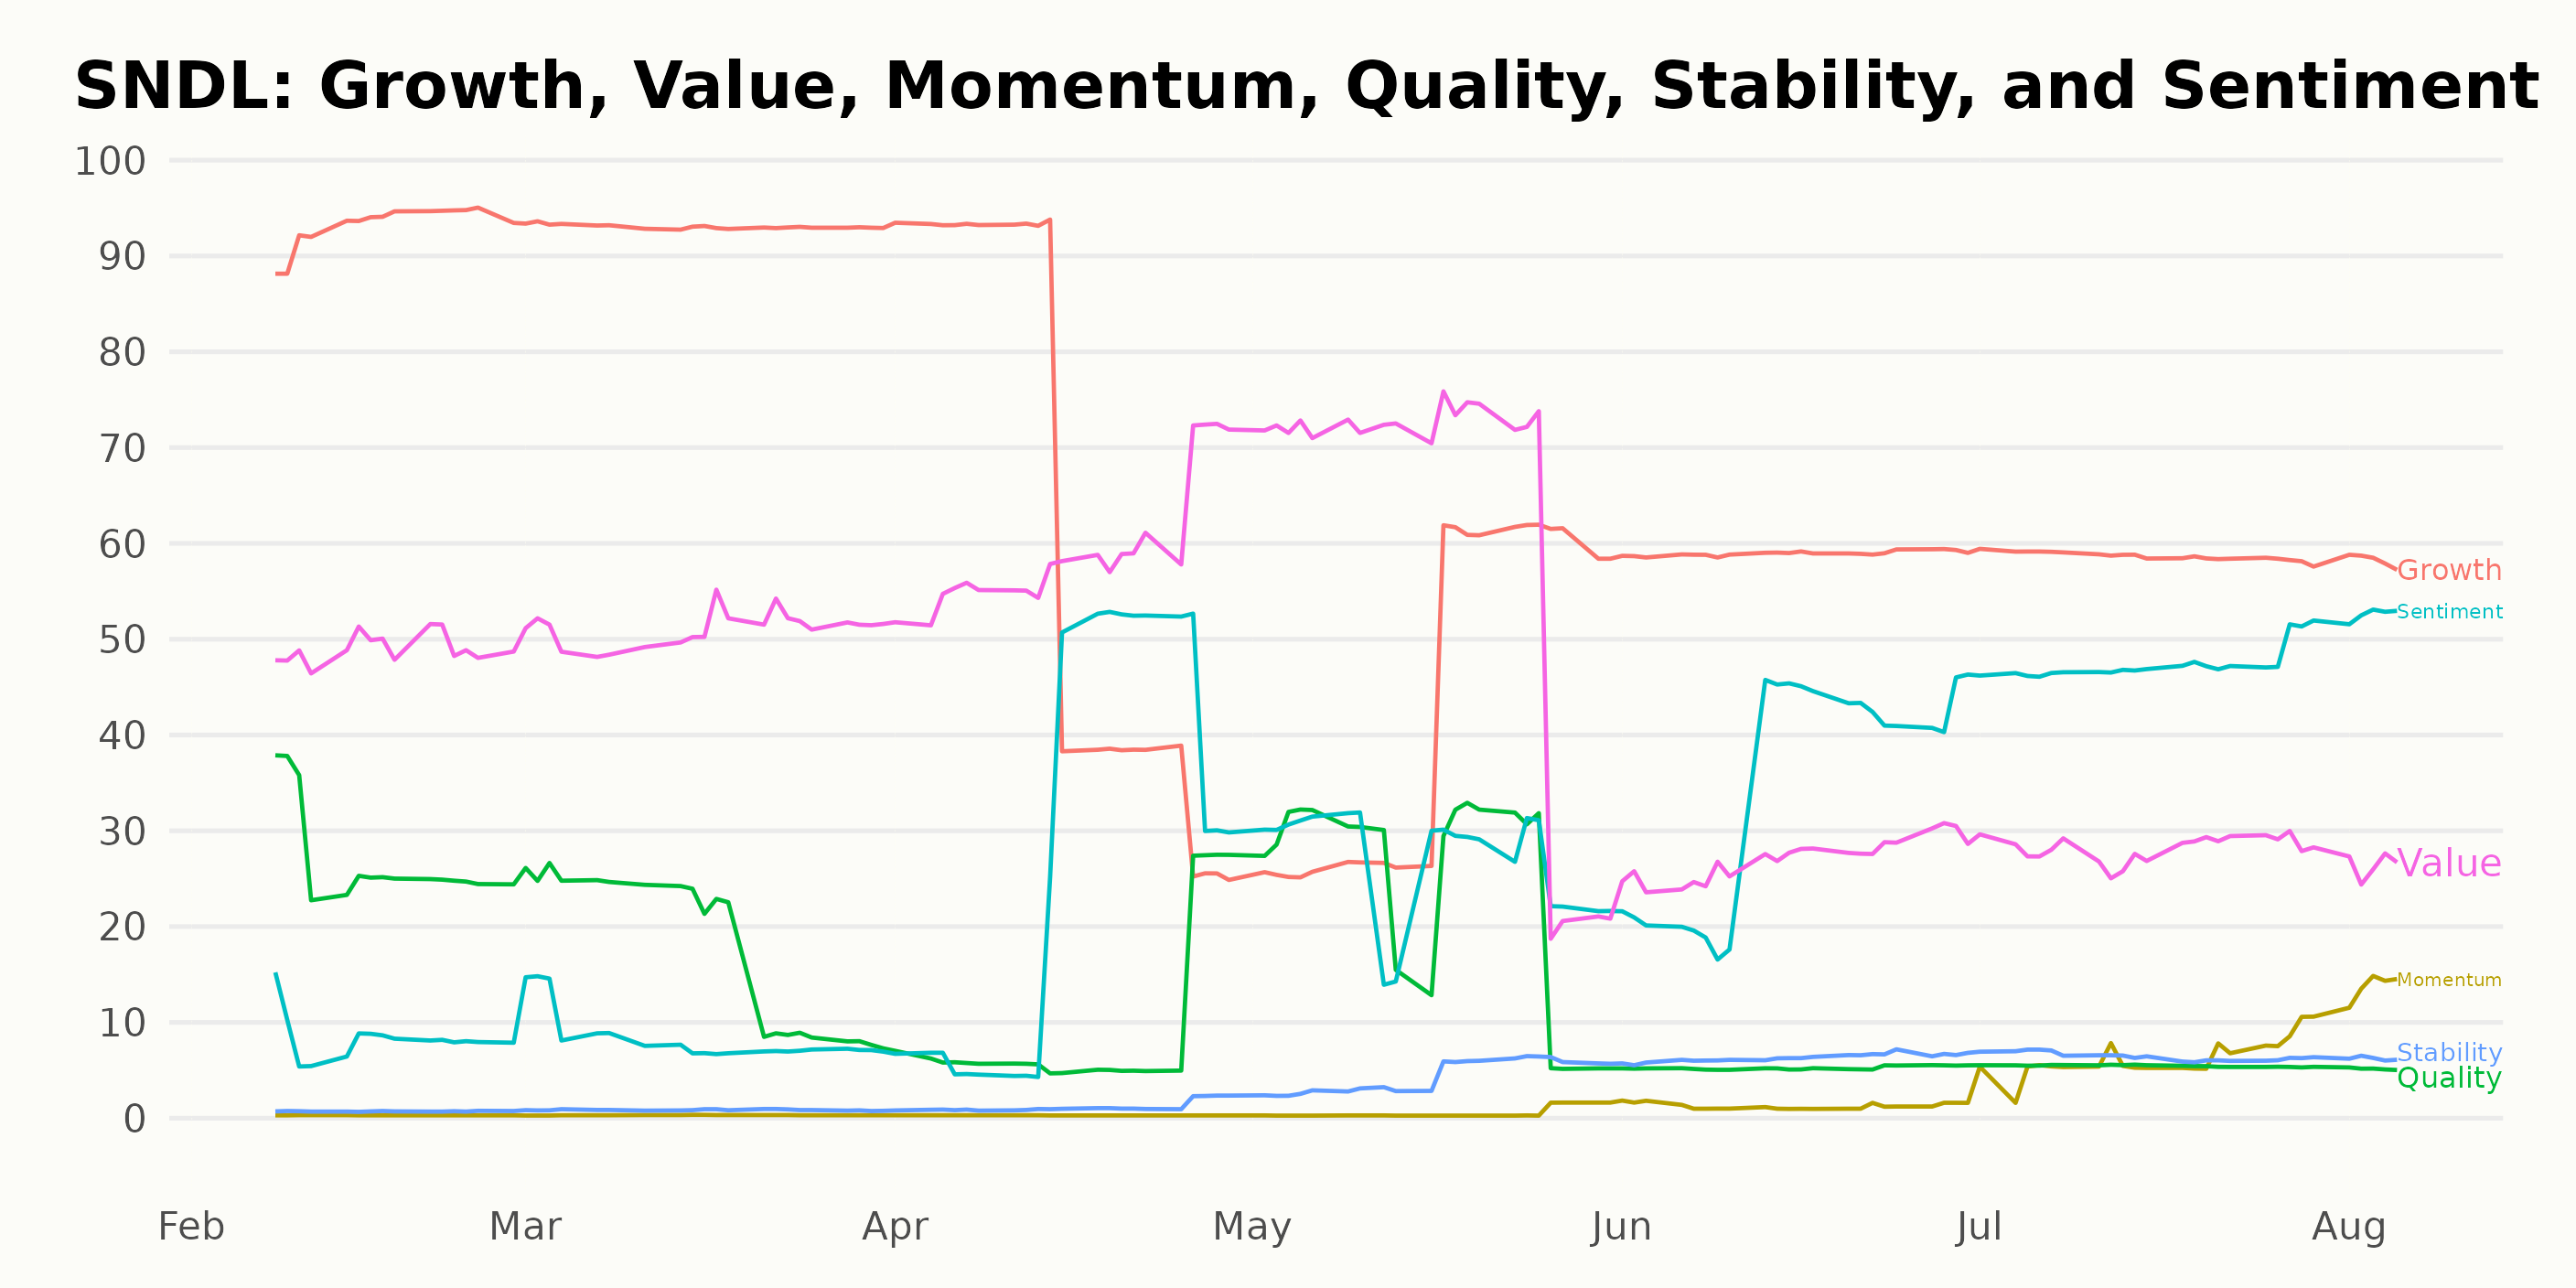
Looking at the POWR Ratings for SNDL, three dimensions stand out as key: Growth, Value, and Sentiment. This summary zeroes in on these critical dimensions.
Growth: In February 2023, SNDL scored high in the growth dimension with a value of 93. The growth score remained unchanged in March 2023. There was a significant downturn in April 2023 when the value dropped to 62. A continued decline was noted in May 2023, with the score descending to 44, before gradually stabilizing between 59 and 58 in the subsequent months leading up to August 2023.
Value: For the value dimension, SNDL recorded a mediocre 49 in February 2023. A steady increase was observed till May 2023, when it reached its highest value score of 63. However, from June 2023, there was a marked decrease, hitting a low of 26 in August 2023.
Sentiment: The sentiment dimension displayed a slow and steady rise over the reviewed period. Starting from a meager 8 in February and March 2023, it improved to 28 in April 2023. The upward trend persisted, escalating to a noteworthy 53 by August 2023.
This analysis reveals some clear trends. The Growth dimension showed a downward curve during this analysis period, while the sentiment went north. The Value dimension had an initial upward trend followed by a swift downturn after May 2023.
How does SNDL Inc. (SNDL) Stack Up Against its Peers?
Other stocks in the Medical - Pharmaceuticals sector that may be worth considering are Novo Nordisk A/S (NVO), Novartis AG (NVS), and Santen Pharmaceutical Co., Ltd. (SNPHY) - they have better POWR Ratings.
43 Year Investment Pro Shares Top Picks
Steve Reitmeister is best known for his timely market outlooks & unique trading plans to stay on the right side of the market action. Click below to get his latest insights…
Steve Reitmeister’s Trading Plan & Top Picks >
SNDL shares were trading at $1.49 per share on Monday afternoon, down $0.01 (-0.34%). Year-to-date, SNDL has declined -28.71%, versus a 18.58% rise in the benchmark S&P 500 index during the same period.
About the Author: Anushka Dutta

Anushka is an analyst whose interest in understanding the impact of broader economic changes on financial markets motivated her to pursue a career in investment research.
The post Is It Finally Time to Buy Shares of SNDL Inc. (SNDL)? appeared first on StockNews.com