Network air carrier American Airlines Group Inc. (AAL) reported producing a record-setting Thanksgiving operation this year. The company attracted nearly 6.5 million customers on more than 59,000 flights this Thanksgiving holiday, marking its highest-ever load factor for the dates. AAL also reportedly went nine days without canceling a mainline flight.
On the other hand, the company posted mixed results in its last reported quarter (the third quarter ended September 30) amid rising fuel costs and dropping fare prices. AAL’s total operating revenue increased marginally year-over-year to $13.48 billion, missing the analyst estimate of $13.52 billion, while its adjusted EPS came in at $0.38, down 44.9% from the prior-year period and compared to the expected $0.25.
Given this scenario, let’s look at the trends of AAL’s key financial metrics to understand why it could be wise to wait for a better entry point in the stock.
American Airlines Group Inc.'s Significant Financial Trends and Challenges: An In-depth Analysis from 2020-2023
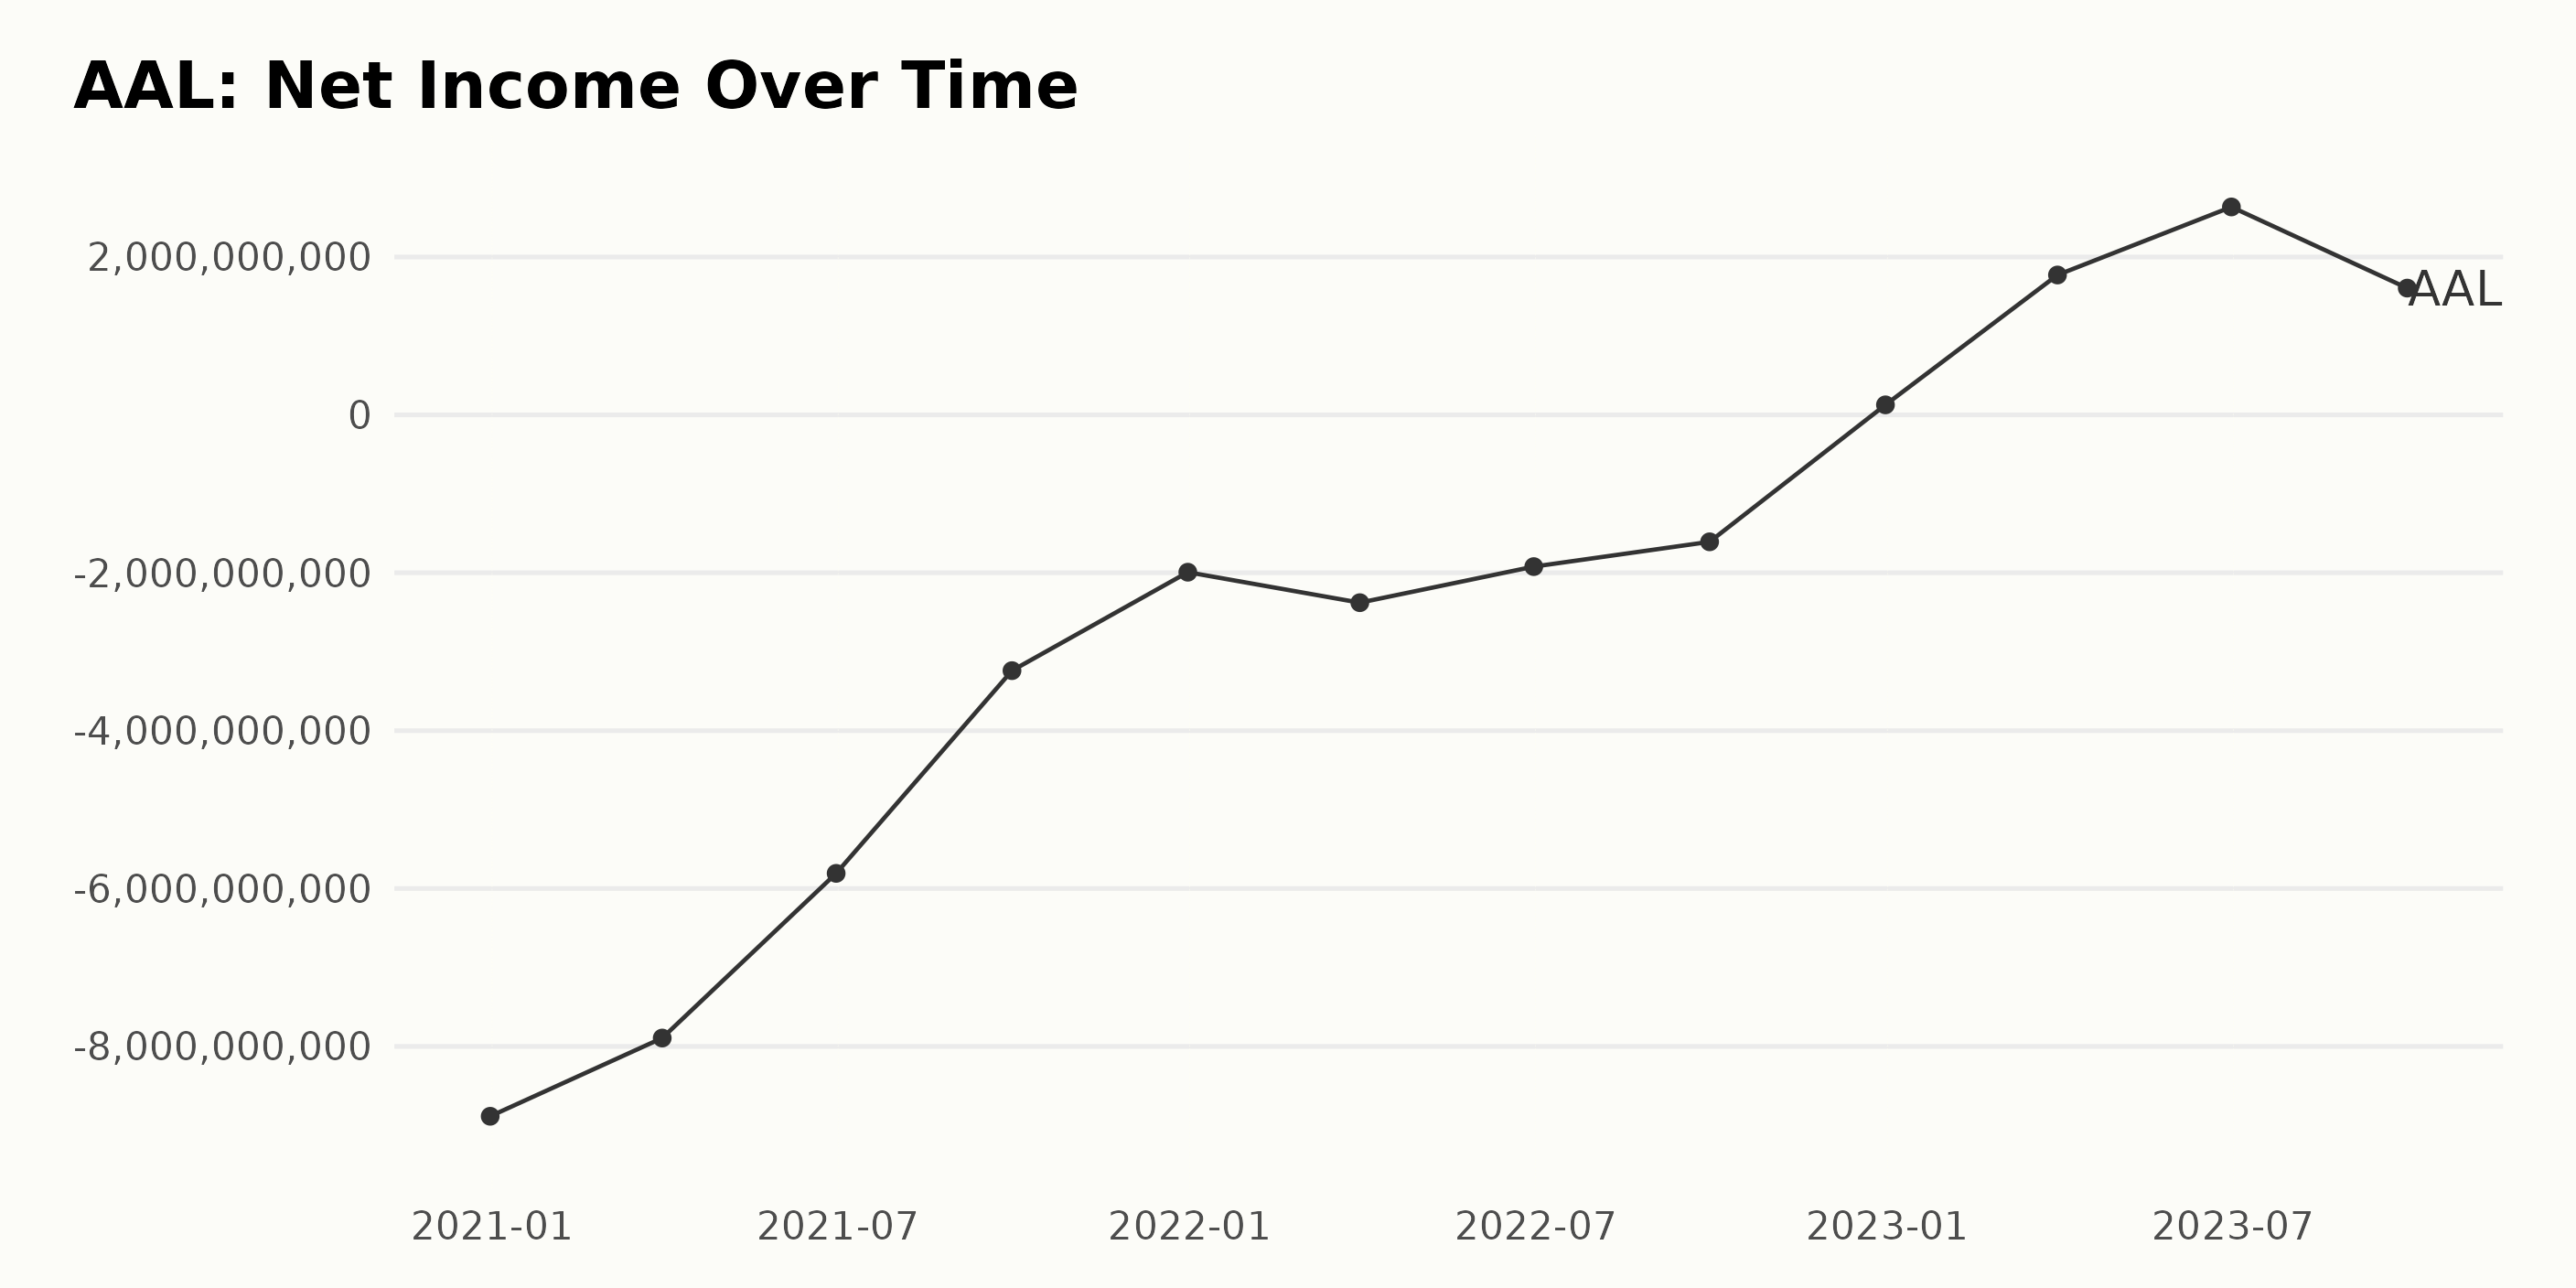
From 2020 to 2023, AAL witnessed a remarkable recovery from its trailing-12-month net income financial situation. Here is a summary of the trend and fluctuations in AAL’s net income over this period:
- On December 31, 2020, net income was reported at -$8.88 billion.
- Subsequent quarters in 2021 showed progressive improvement, with net income figures being -$7.89 billion in March, -$5.81 billion in June, -$3.24 billion in September, and -$1.99 billion in December, respectively.
- The first two quarters of 2022 showed values of -$2.38 billion in March and -$1.92 billion in June. However, it significantly improved in September, reducing the deficit to -$1.61 billion. By the end of December 2022, a positive net income of $127 million was reported, the first positive figure since our records began in December 2020.
- The first three quarters of 2023 marked consistent growth in net income, a stark contrast to previous years. In March 2023, AAL reported a net income of $1.77 billion. This continued to increase to $2.63 billion by June. However, the next quarter saw a dip in growth, bringing the net income down to $1.61 billion by September.
It can further be noted that from December 31, 2020, to September 30, 2023, AAL's net income grew from -$8.88 billion to $1.61 billion. This represents a significant turnaround in AAL's financial performance.
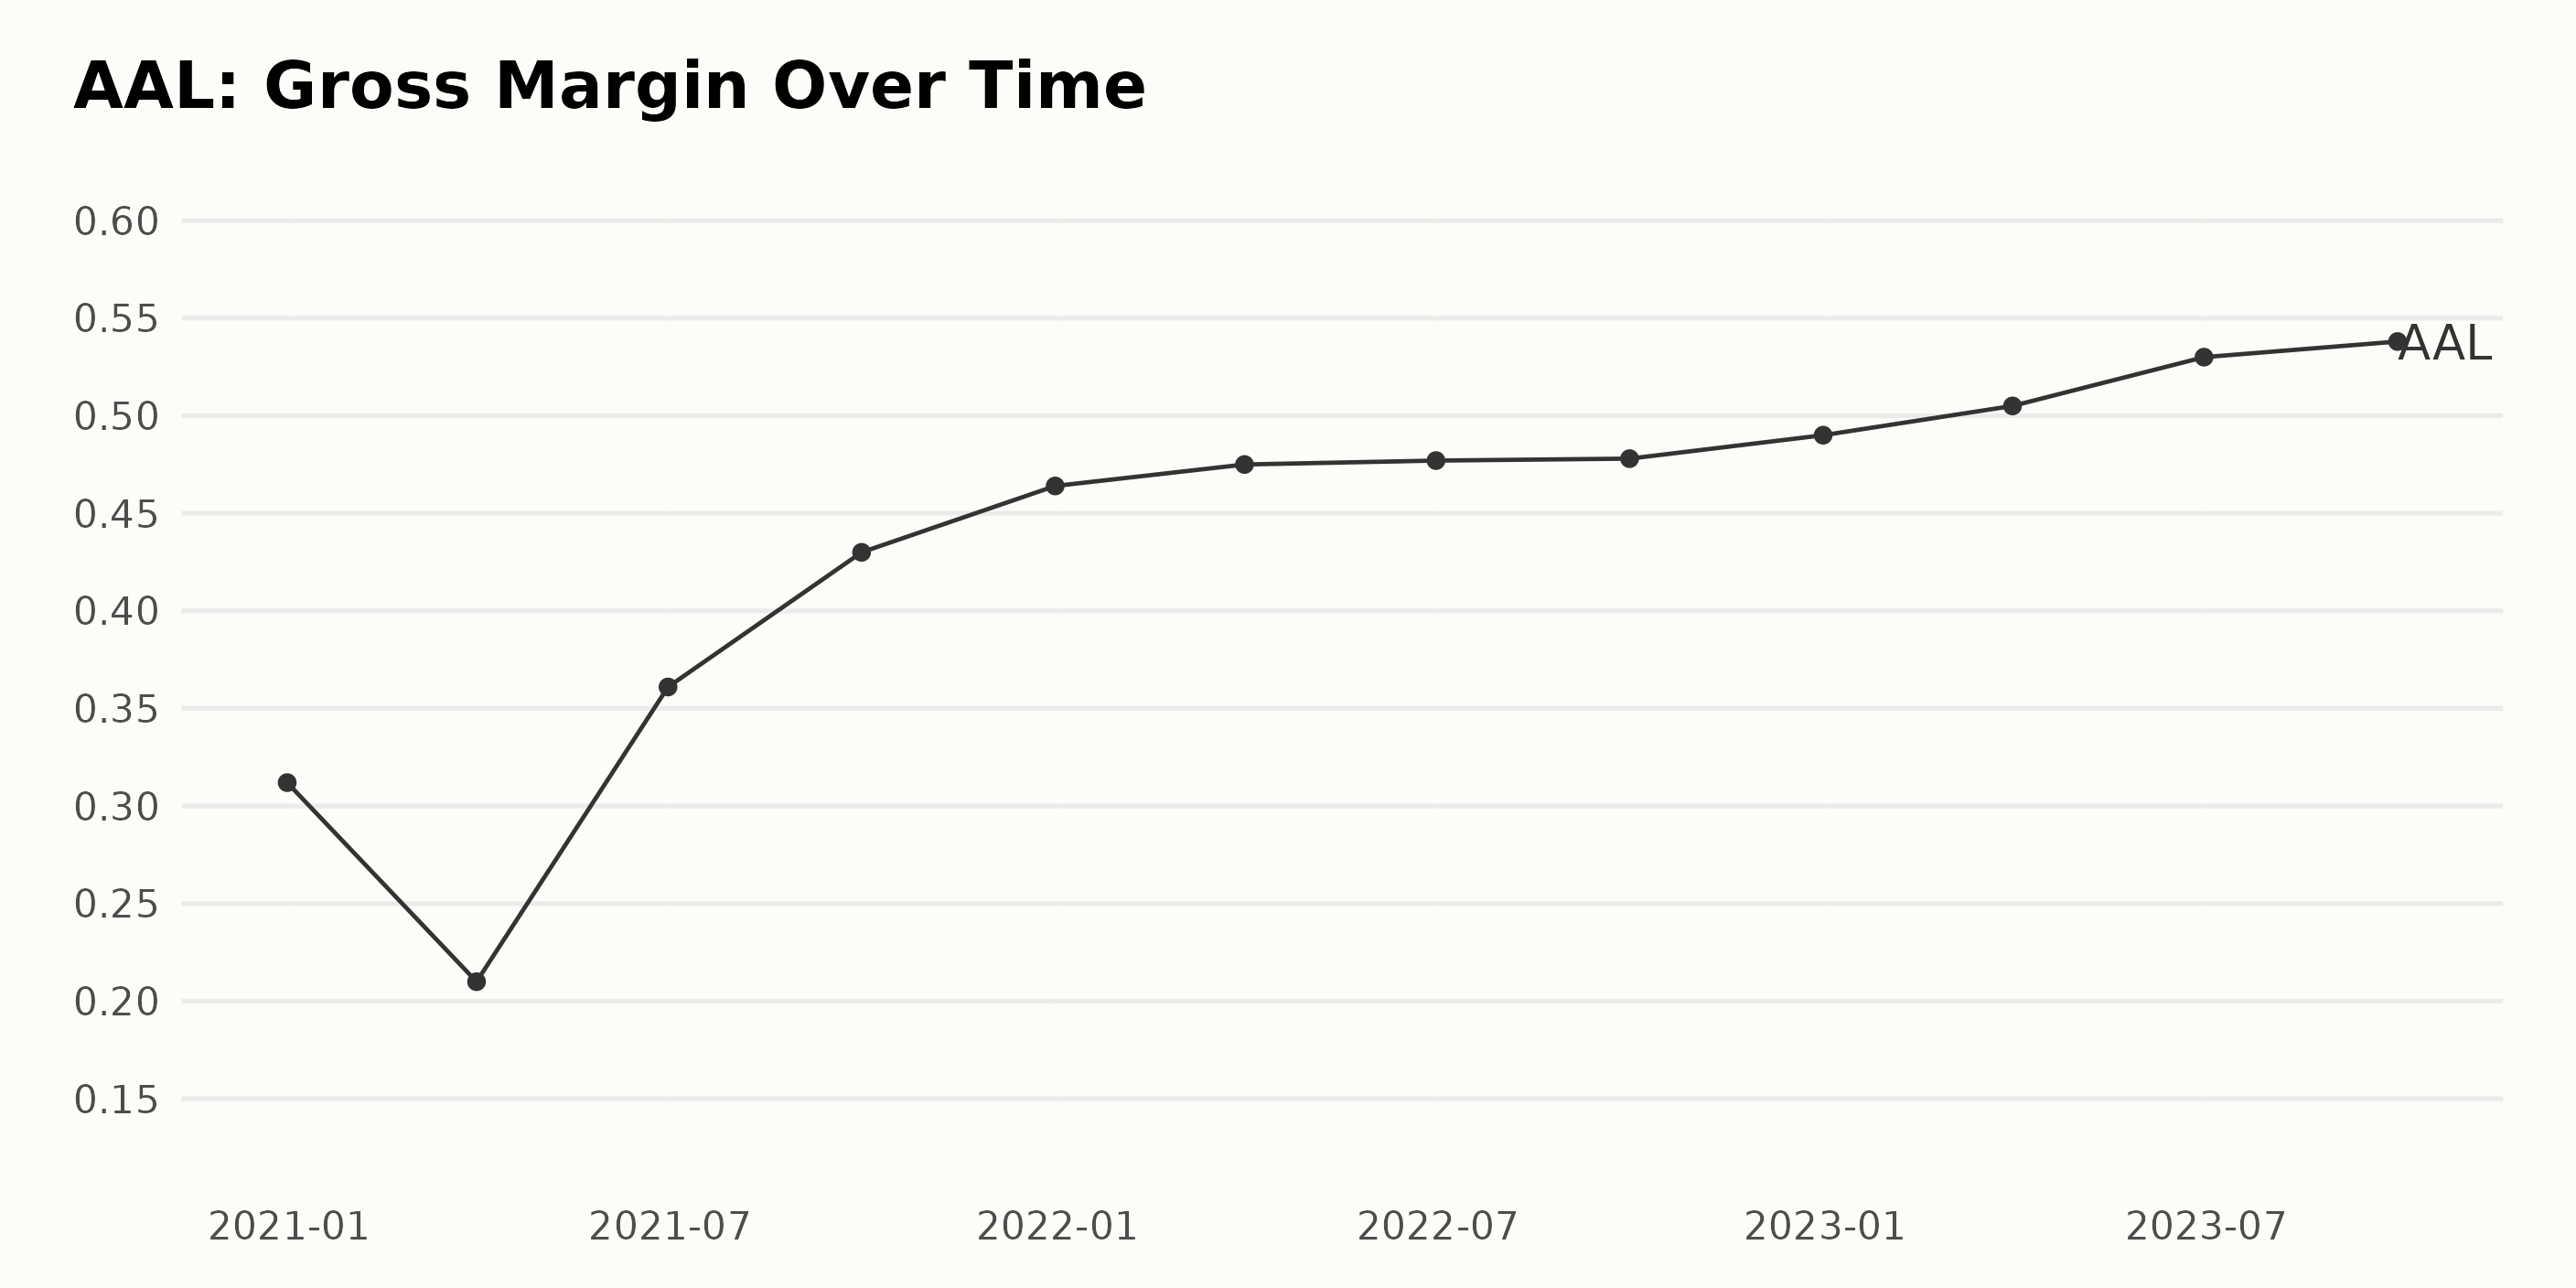
The data series shows a trend of increasing gross margin for AAL over the period from December 31, 2020, to September 30, 2023. Over this time frame, it’s evident that the gross margin experienced fluctuations but the general pattern is an upward trajectory.
Breaking down this trend:
- As of December 31, 2020, the gross margin was 31.2%.
- There was a noticeable dip in gross margin to 21.0% by March 31, 2021.
- Subsequently, a dramatic rise occurred over the next quarters, with the gross margin reaching 36.1% by June 30, 2021, and rising further to 43.0% in September 2021.
- This upward trend continued into 2022, albeit at a slower pace, with the gross margin reported as 46.4% as of December 31, 2021.
- During 2022, the growth rate in gross margin somewhat stabilized, reported at 47.5%, 47.7%, and 47.8% during the first three quarters, respectively, before breaking past 49.0% by the end of December.
- The steady growth persisted throughout 2023, reaching a peak of 53.8% by September 30.
Emphasizing the more recent data, as of September 30, 2023, the gross margin was reported as 53.8%. This figure marks the highest value in the series and represents the culmination of three years of general growth.
Calculating the growth rate reveals that over the described period, the gross margin grew at a rate of approximately 22.6% (from 31.2% in December 2020 to 53.8% in September 2023).
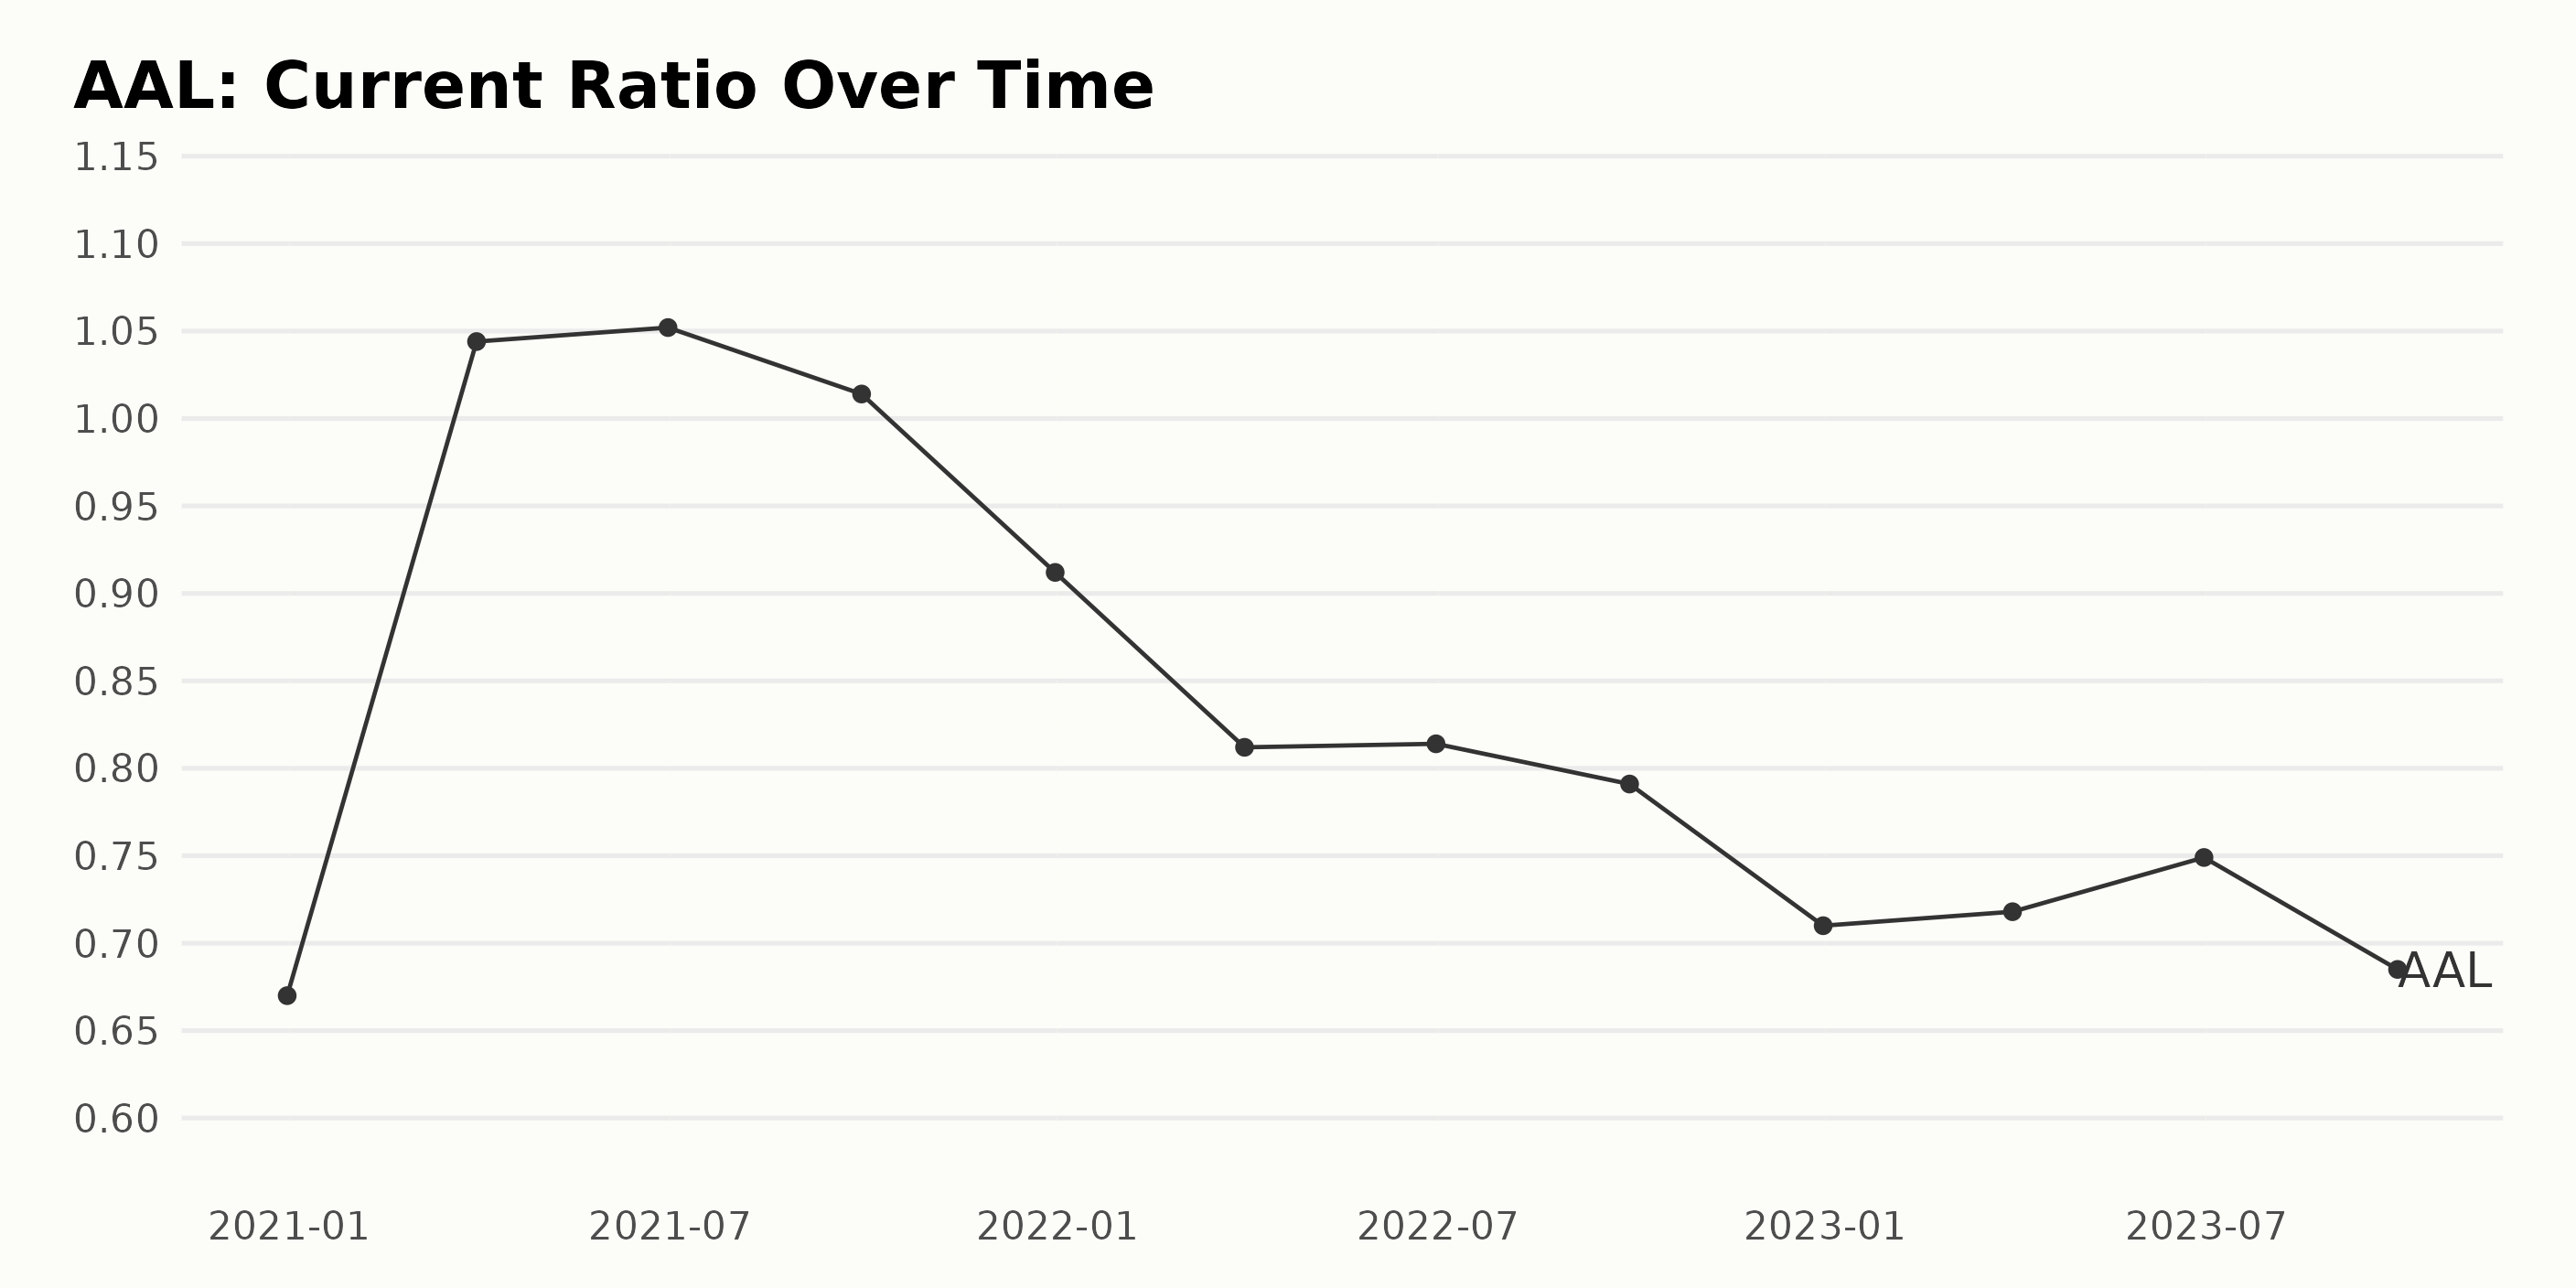
The current ratio of AAL has demonstrated significant variability over time. Specifying the key observations:
- As of December 31, 2020, the current ratio was 0.67.
- It saw a notable increase in the first half of 2021, reaching 1.052 by June 30, 2021.
- This was followed by a period of a downward trend commencing in the latter half of 2021. It decreased to 0.912 by the end of 2021 and further diminished to 0.71 by December 31, 2022.
- In 2023, there was a minor recovery in the first half of the year with the current ratio increasing to 0.749 by June 30, 2023. However, this was followed by a decrease to 0.685 by September 30, 2023.
Summary of Recent Data:
- Recent months have seen marginal variations in the current ratio of AAL. As of September 30, 2023, the ratio stands at 0.685, showing a decrease from 0.749 in June 2023.
- Overall, from December 31, 2020, to September 30, 2023, the current ratio decreased by around 12%, reflecting a negative growth rate over this period.
While this summary covers broad trends, it is important to consider company-specific and broader market conditions when interpreting financial ratios such as the current ratio. If current assets are significantly lower than current liabilities, it may indicate potential problems in meeting short-term financial obligations.
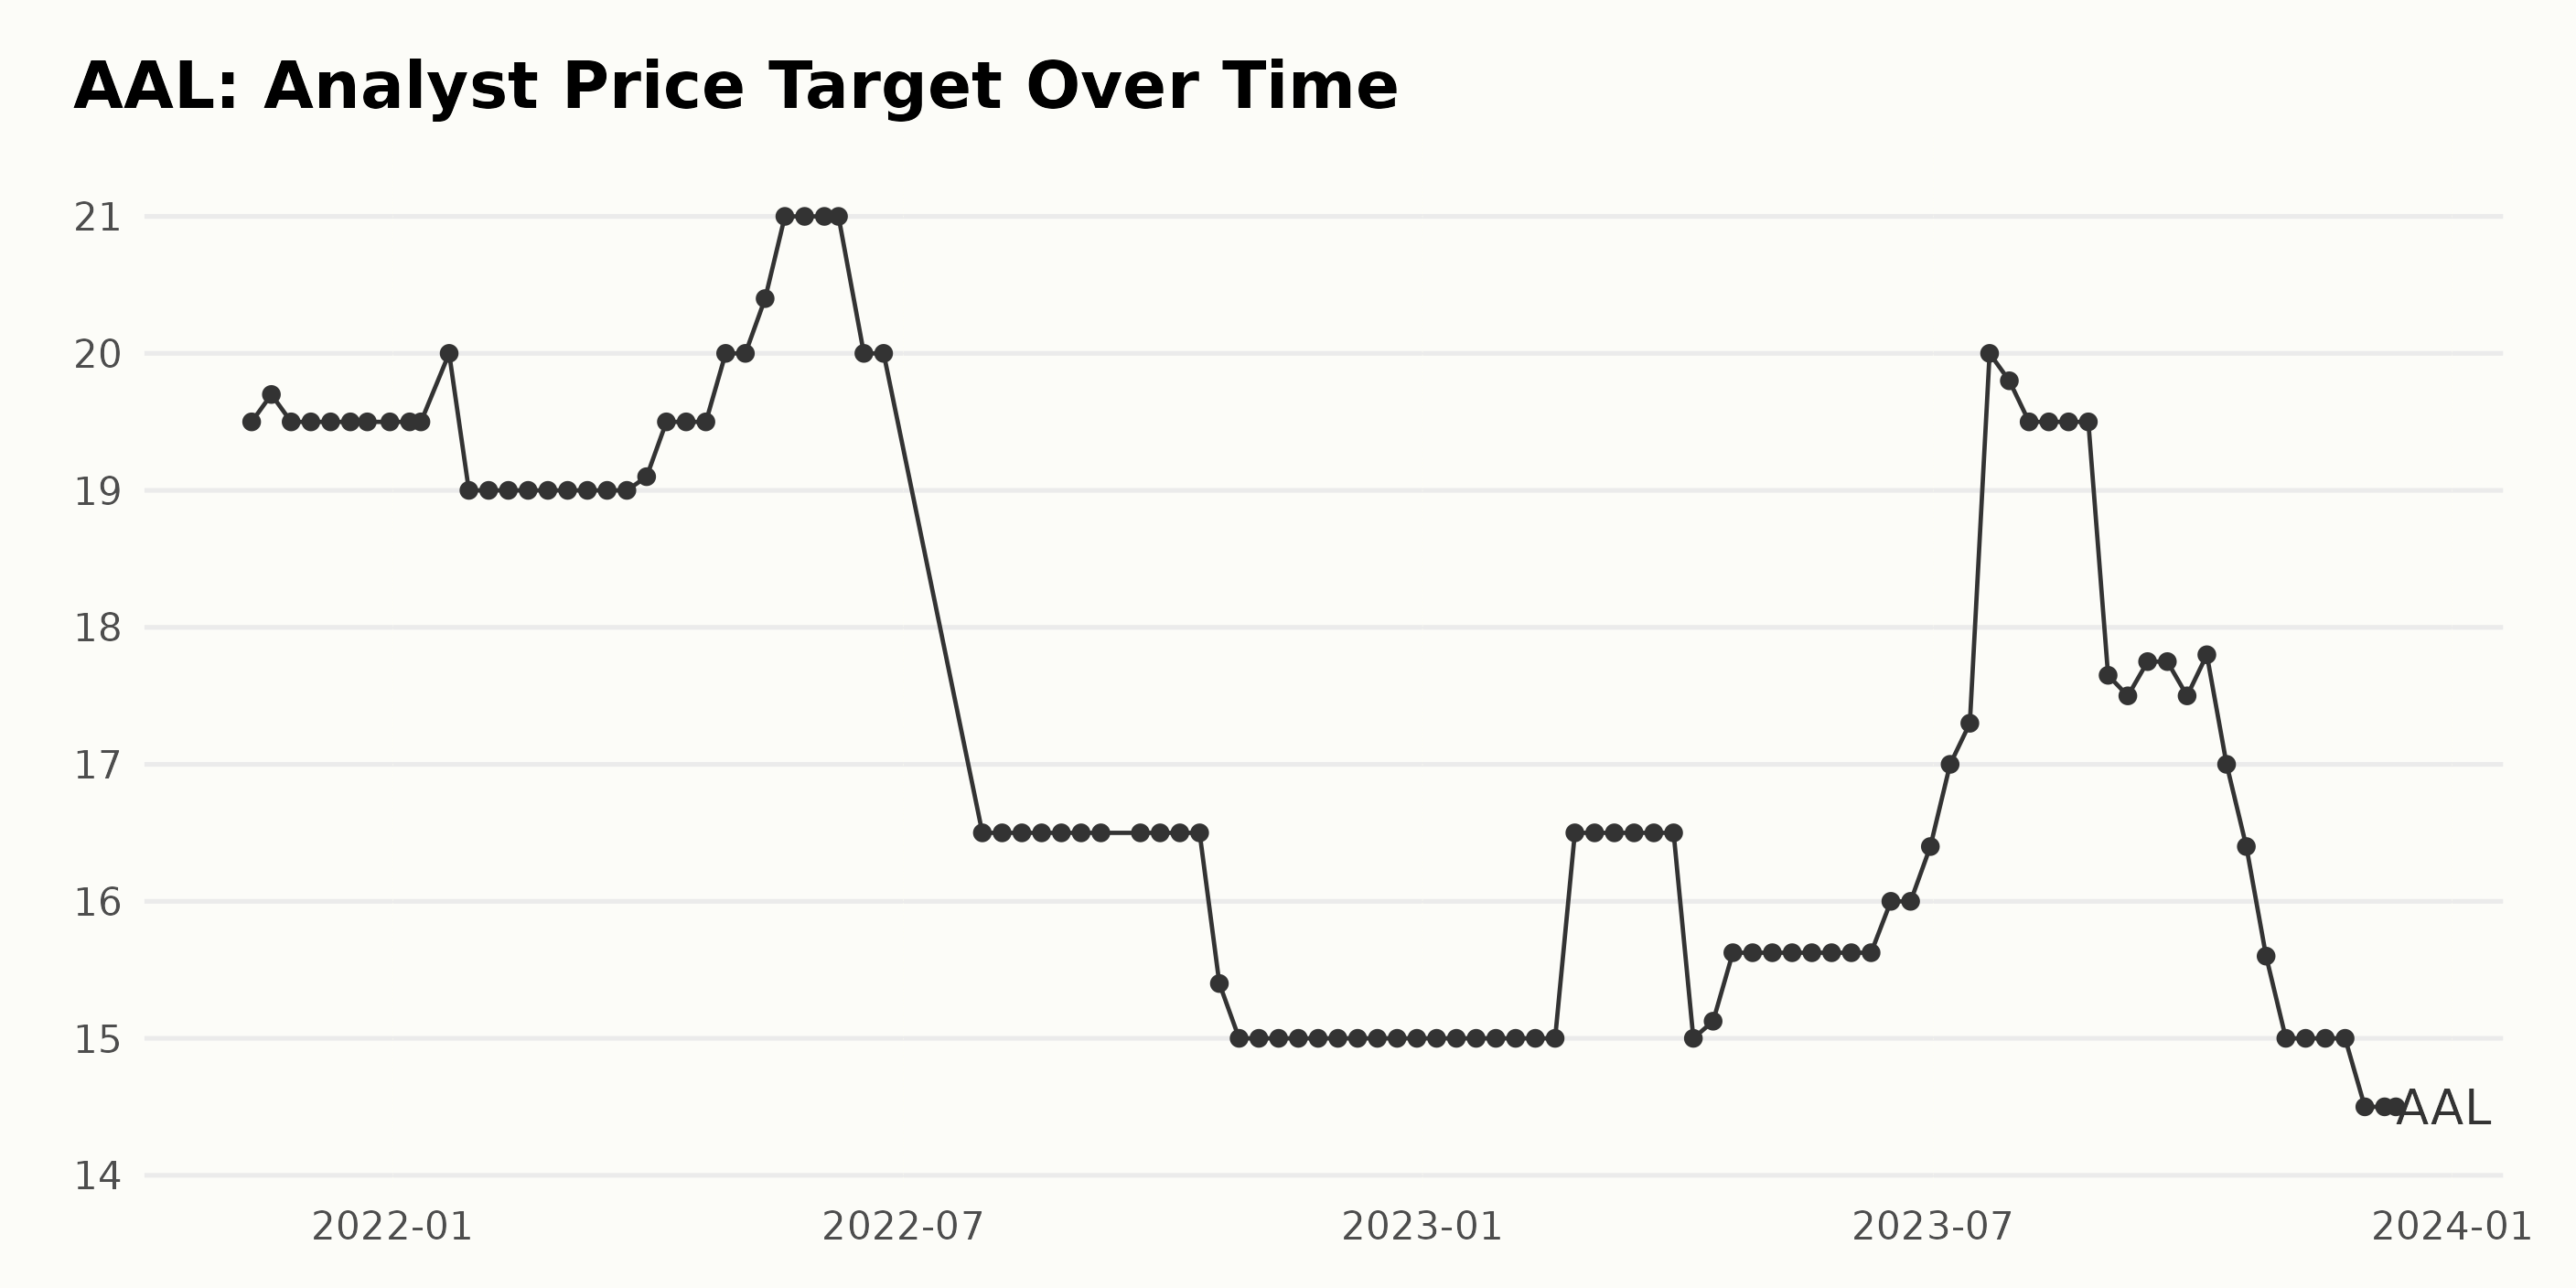
The analyst price target for AAL has shown both steady phases and fluctuations over the years from November 2021 to December 2023.
Main Trends:
- The price target remained fairly stable at around $19.5 from November 2021 until January 2022.
- In the first half of 2022, the price target saw a peak in May at $21 before dropping significantly down to $16.5 in July and early August.
- There was a dramatic decrease in late October 2022, where the target was reduced from $16.5 to $15 within a week.
- A quick recovery was seen in February 2023 when the target increased from $15 to $16.5 over four weeks.
- The highest peak was evident in July 2023 when the price target reached $20.
Recent Fluctuations:
- From July to August 2023, the price decreased from the year's maximum of $20 to $19.5.
- The weekly targets fluctuated between $17.5 and $17.8 in September 2023, decreasing to $15 by November 2023.
- The last data point in the series, taken on December 12, 2023, shows a slight decrease to $14.5.
Growth Rate: Calculating the growth rate by comparing the final value ($14.5 in December 2023) with the initial value ($19.5 in November 2021), there is a negative growth rate. This indicates an overall decrease in the analyst price target over these two years.
Six-Month Performance of American Airlines: Peaks, Troughs and Recovery Examined
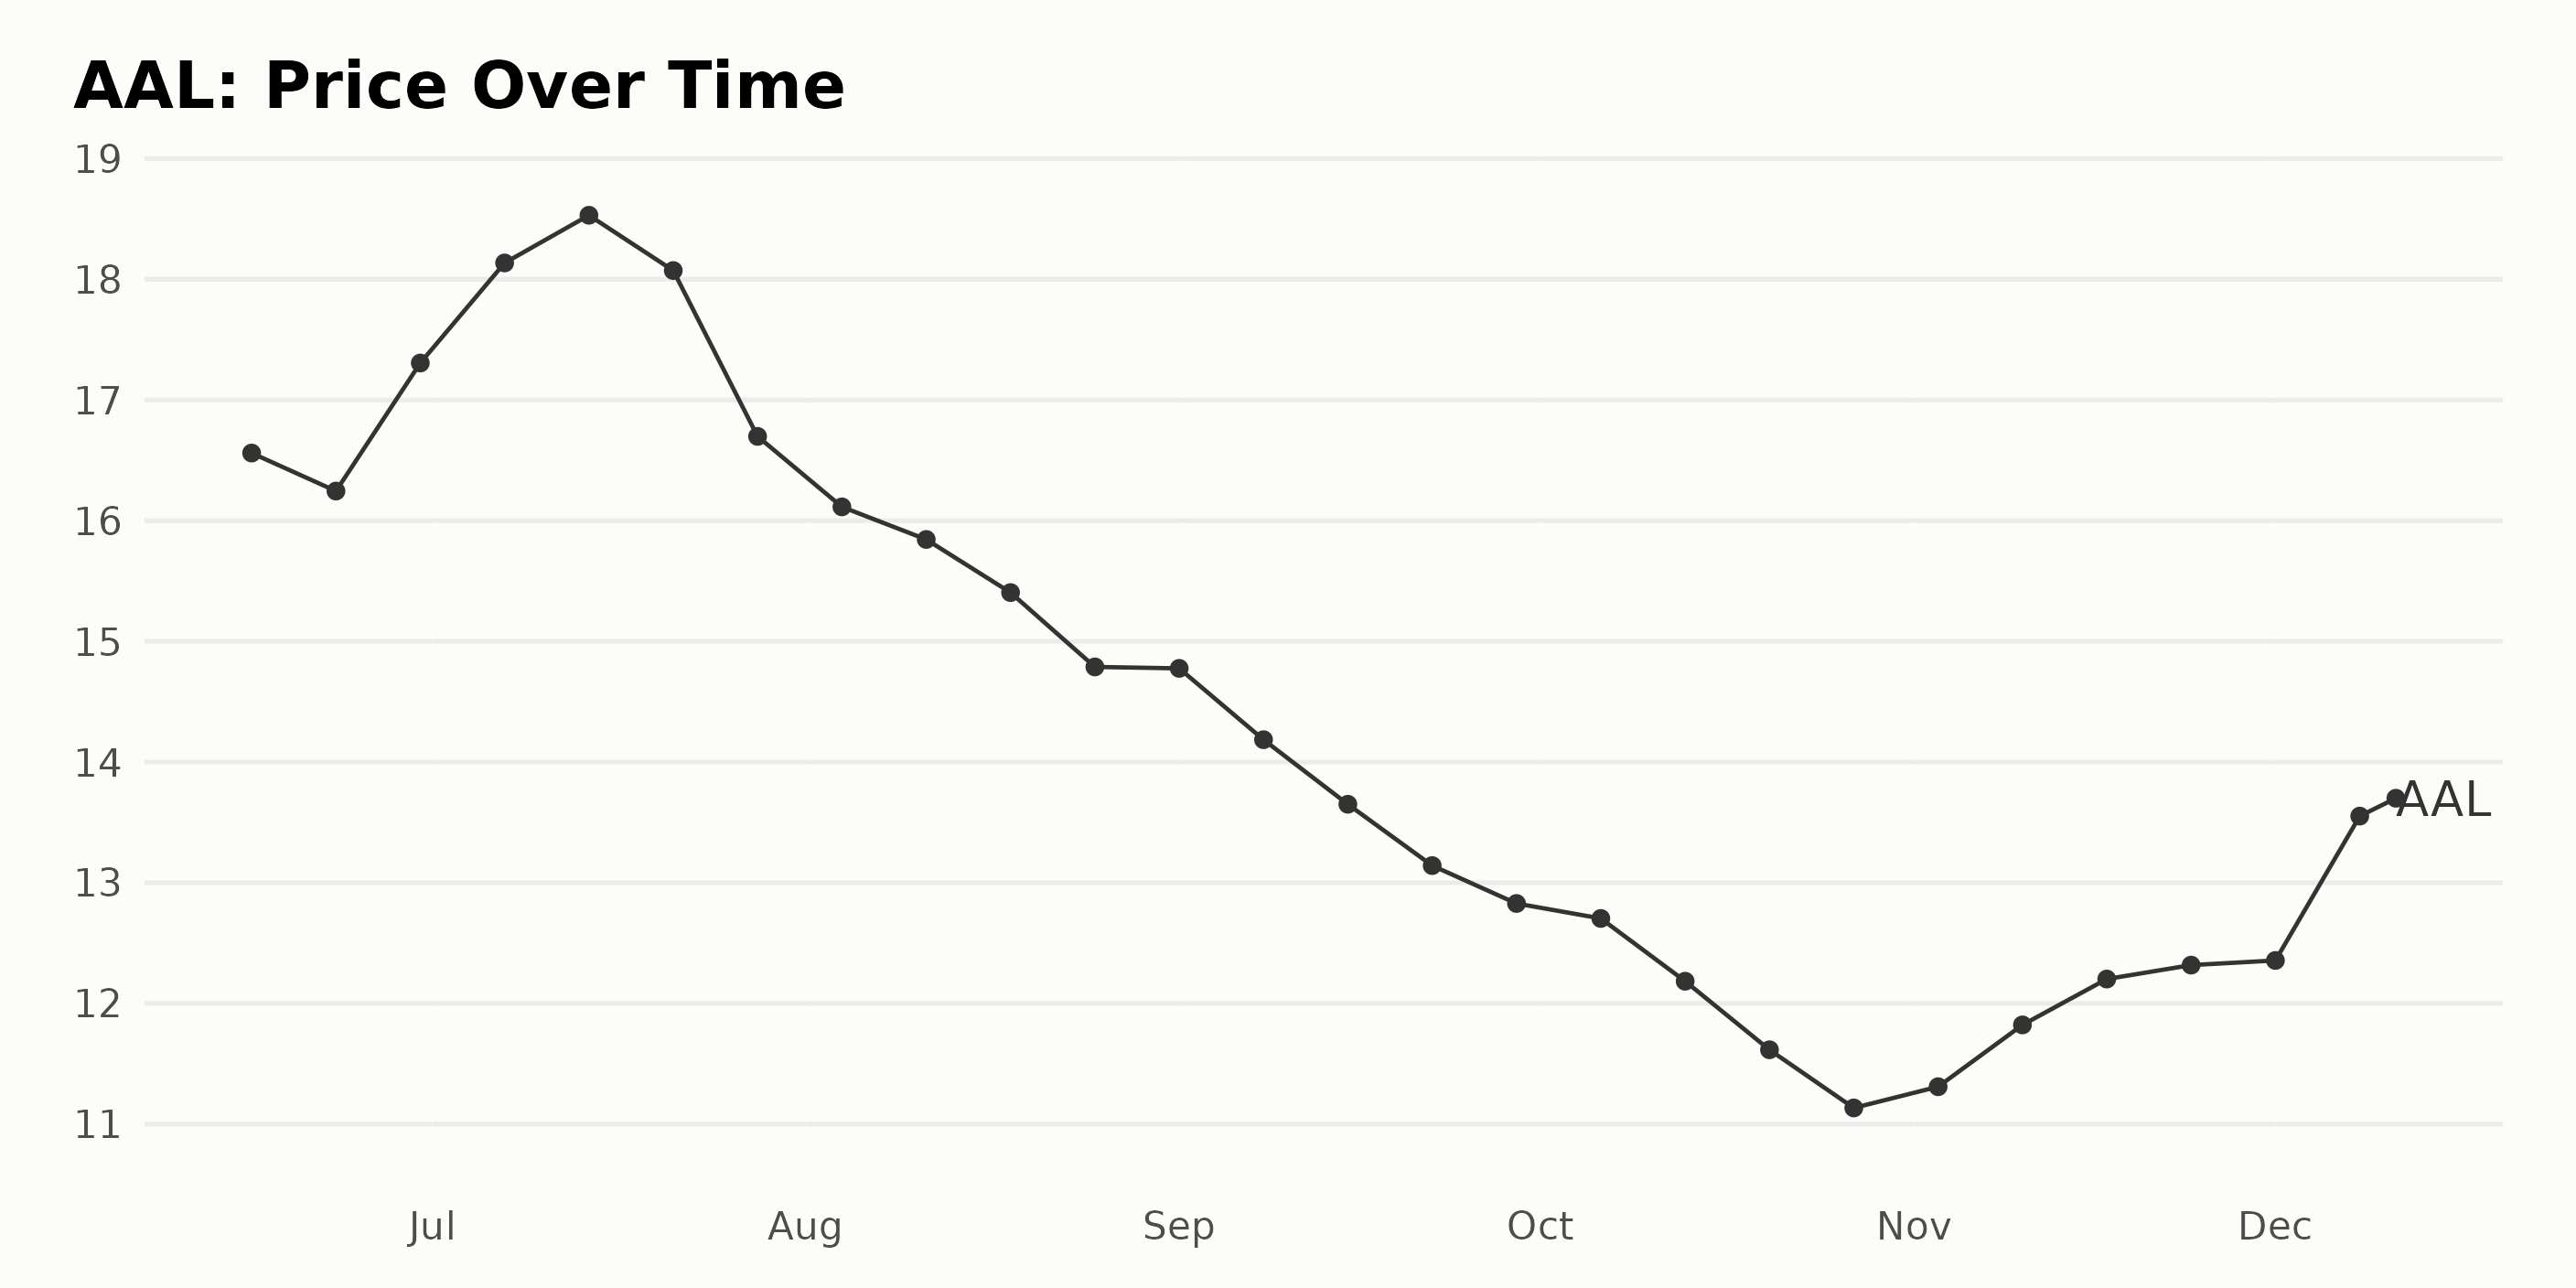
Examining the share price data of AAL between June and December 2023, a few key trends emerge:
- In June 2023, the share price initially decreased from $16.56 to $16.24 in one week but then increased rapidly to $17.31 by the end of the month.
- The upward trend continued into early July, peaking at $18.53, the highest value in this period, on July 14.
- Compared to the peak price, there was a clear downward trajectory from mid-July to late September, reaching a low point of $13.14 on September 22. Within the two-month span from mid-July to mid-September, AAL’s shares saw a significant decrease in value.
- The lowest share price recorded in this period was $11.13 on October 27, 2023.
- From November, the downward trend seemed to reverse, with share prices gradually increasing to $13.72 by December 11, 2023.
Overall, the trend within the six-month period indicates a volatile performance for AAL. Following the peak in July, the acceleration of a downward trend is notable until September, followed by an apparent stabilization and eventually a slow but steady recovery towards the end of the year. Here is a chart of AAL's price over the past 180 days.
Analyzing American Airlines' Performance: Value Stable, Growth Drops, Quality Mildly Decreases
The POWR Ratings grade of AAL in the Airlines category has shown a consistent improvement over the past months. Here's a detailed breakdown:
- From June 17, 2023, to August 26, 2023, AAL maintained a POWR grade of B (Buy). However, its rank slipped from #9 to #14 among the 28 stocks in its category.
- On September 2, 2023, the POWR grade reflected a downgrade to C (Neutral) and held the rank of #15.
- In the following weeks leading up to October 21, 2023, there was no change in the POWR grade, but AAL managed to improve its rank gradually to #13. However, by October 28, 2023, its ranking dropped to #16.
- The latest data point, as of December 12, 2023, shows that AAL has retained a POWR Grade of C (Neutral) and still holds on to the 16th position.
Remarkably, even in the face of fluctuations in its ranking within the category, AAL has not seen extreme swings in its POWR Grade. This kind of stability might reflect positive consistency in some of its underlying metrics.
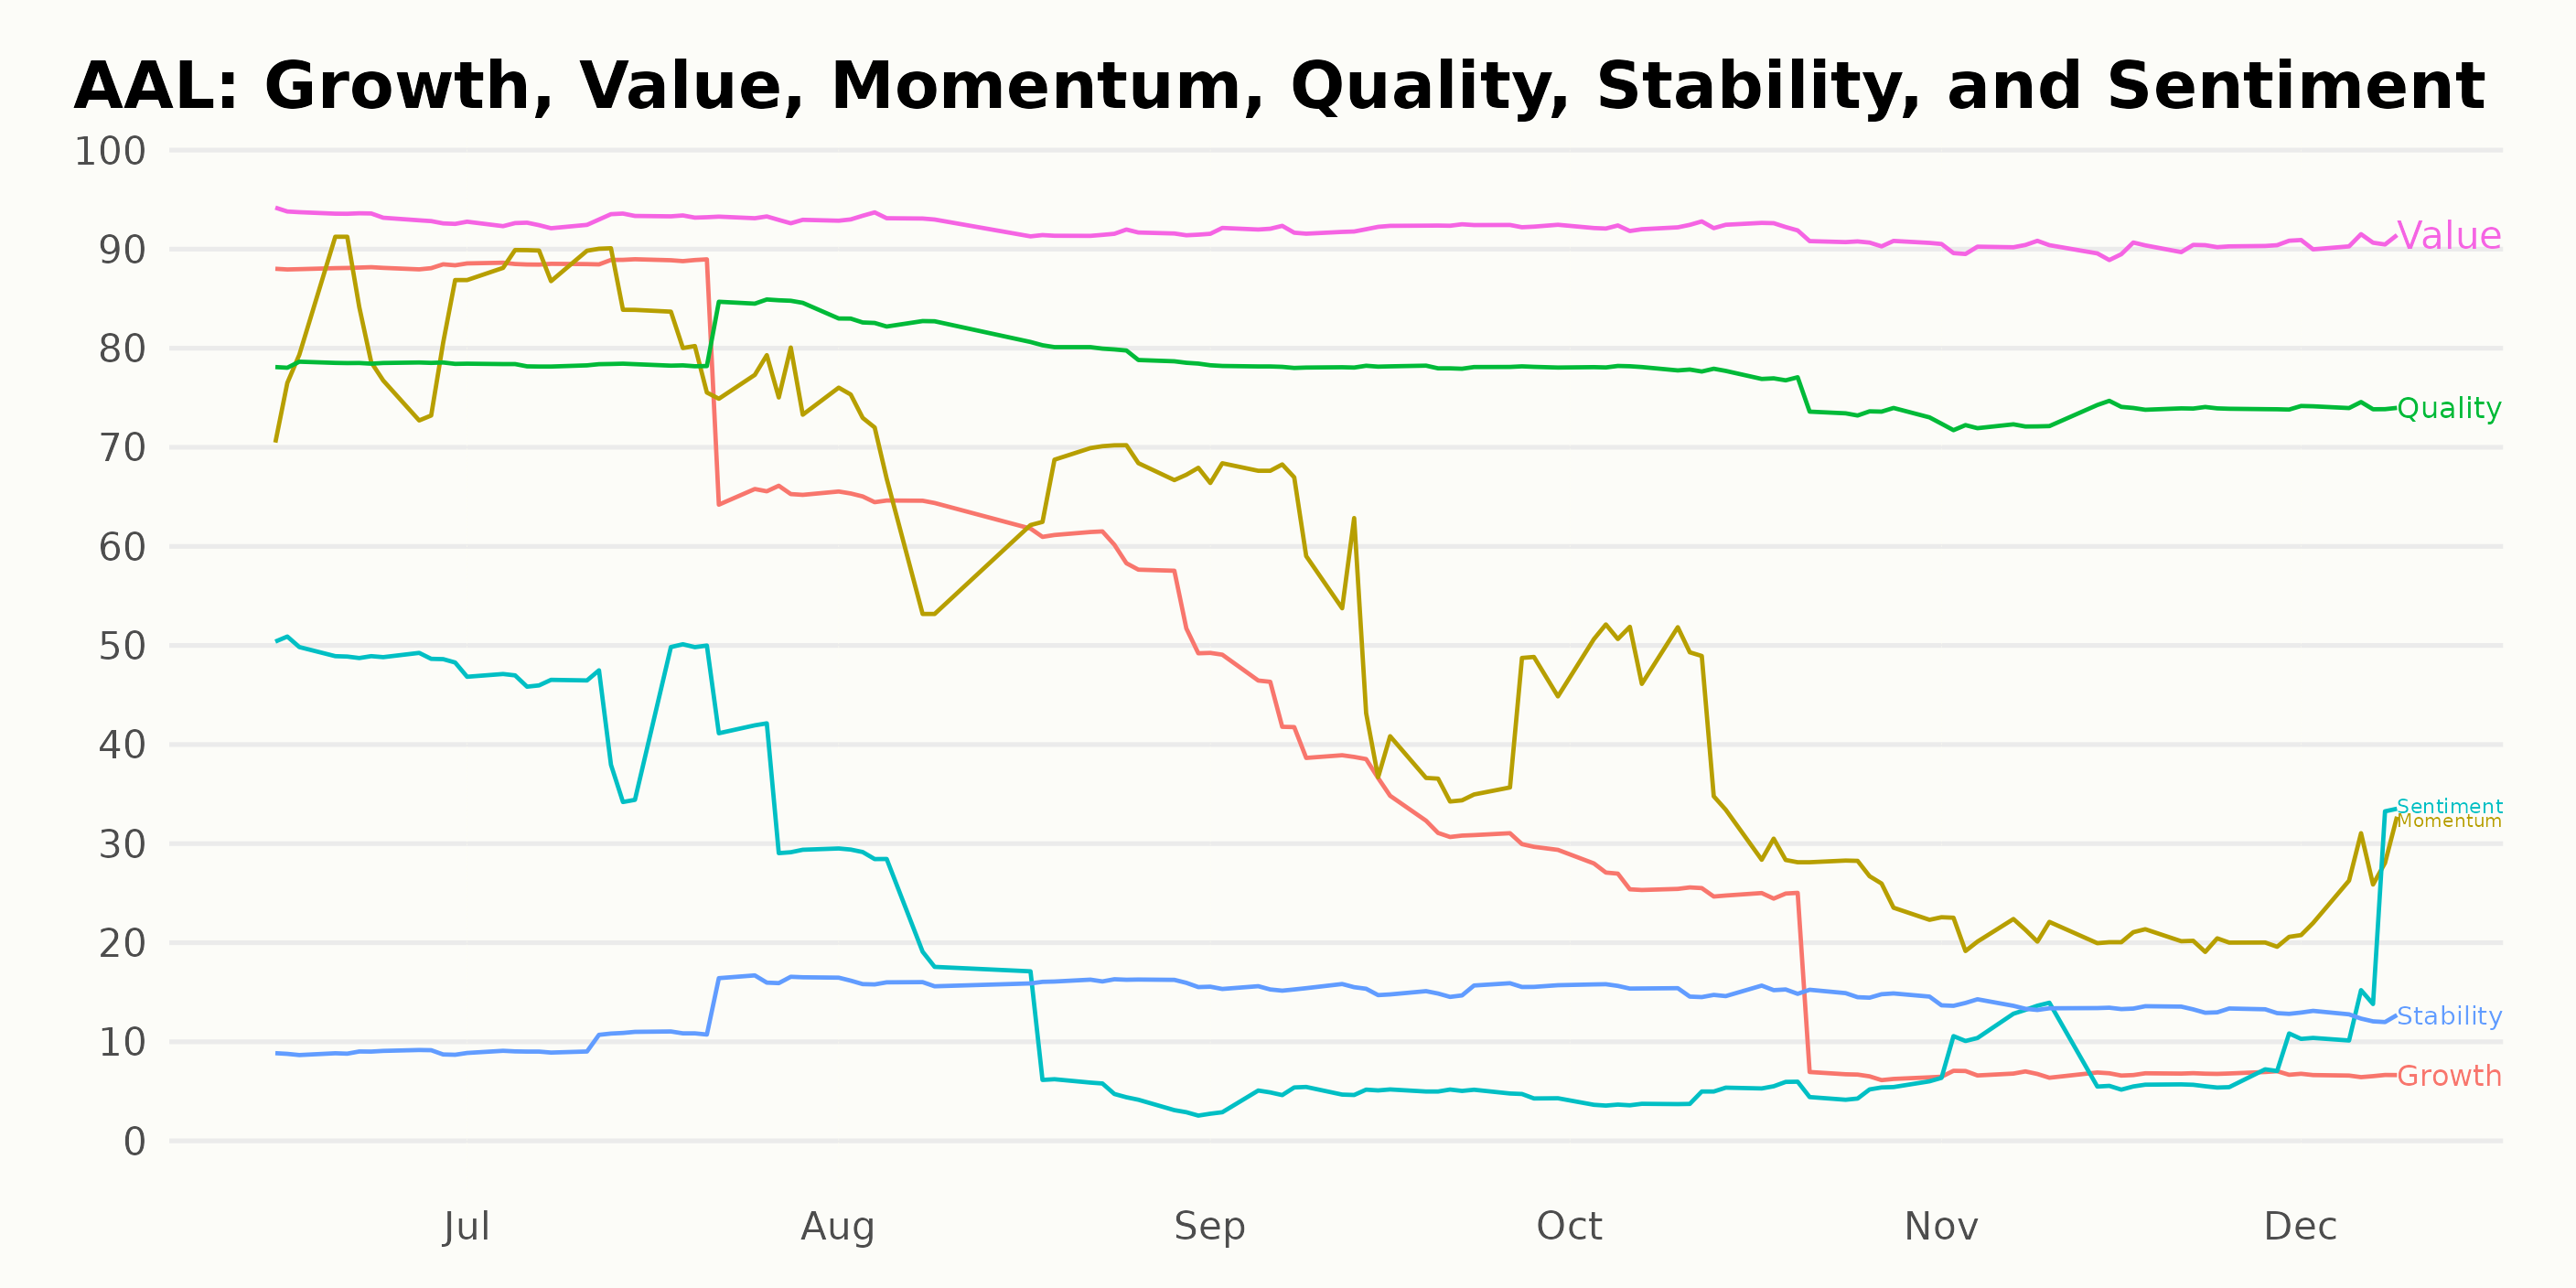
For AAL, the POWR Ratings highlight three noteworthy dimensions. Over a period from June 2023 to December 2023, the highest ratings consistently came under the dimensions of Value, Growth, and Quality.
Value Dimension: AAL's Value dimension consistently received top ratings throughout this period. The scores in this area ranged between 90 and 93, indicating a stable performance over time.
- June, 2023: 93
- July, 2023: 93
- August, 2023: 92
- September, 2023: 92
- October, 2023: 92
- November, 2023: 90
- December, 2023: 91
Growth Dimension: The Growth dimension started strong but showed a clear downward trend over the period. It started at a high rating of 88 in June 2023, but by December 2023, it had sharply fallen to a score of 7.
- June, 2023: 88
- July, 2023: 82
- August, 2023: 61
- September, 2023: 37
- October, 2023: 19
- November, 2023: 7
- December, 2023: 7
Quality Dimension: In the Quality dimension, AAL achieved relatively stable scores, fluctuating mildly between 73 and 81. However, the trend was slightly downward over time.
- June, 2023: 78
- July, 2023: 80
- August, 2023: 81
- September, 2023: 78
- October, 2023: 76
- November, 2023: 73
- December, 2023: 74
In conclusion, while Value remained significantly high and steady for AAL, the company's Growth dimension saw a substantial decrease, and Quality mildly decreased throughout the period from June 2023 to December 2023.
How does American Airlines Group Inc. (AAL) Stack Up Against its Peers?
Other stocks in the Airlines sector that may be worth considering are Cathay Pacific Airways Limited (CPCAY), Air Canada (ACDVF), and easyJet plc (ESYJY) - they have better POWR Ratings. Click here to explore more Airlines stocks.
What To Do Next?
Discover 10 widely held stocks that our proprietary model shows have tremendous downside potential. Please make sure none of these “death trap” stocks are lurking in your portfolio:
AAL shares were trading at $14.00 per share on Tuesday morning, up $0.28 (+2.04%). Year-to-date, AAL has gained 10.06%, versus a 22.20% rise in the benchmark S&P 500 index during the same period.
About the Author: Anushka Dutta

Anushka is an analyst whose interest in understanding the impact of broader economic changes on financial markets motivated her to pursue a career in investment research.
The post American Airlines (AAL) December Outlook: Buy or Sell? appeared first on StockNews.com